What is Microsoft Fabric?
Microsoft Fabric explained: how OneLake, data engineering, and Power BI work together, and when the platform is valuable for your organization.

Jesper de Groot
Data Engineer
Data Engineering
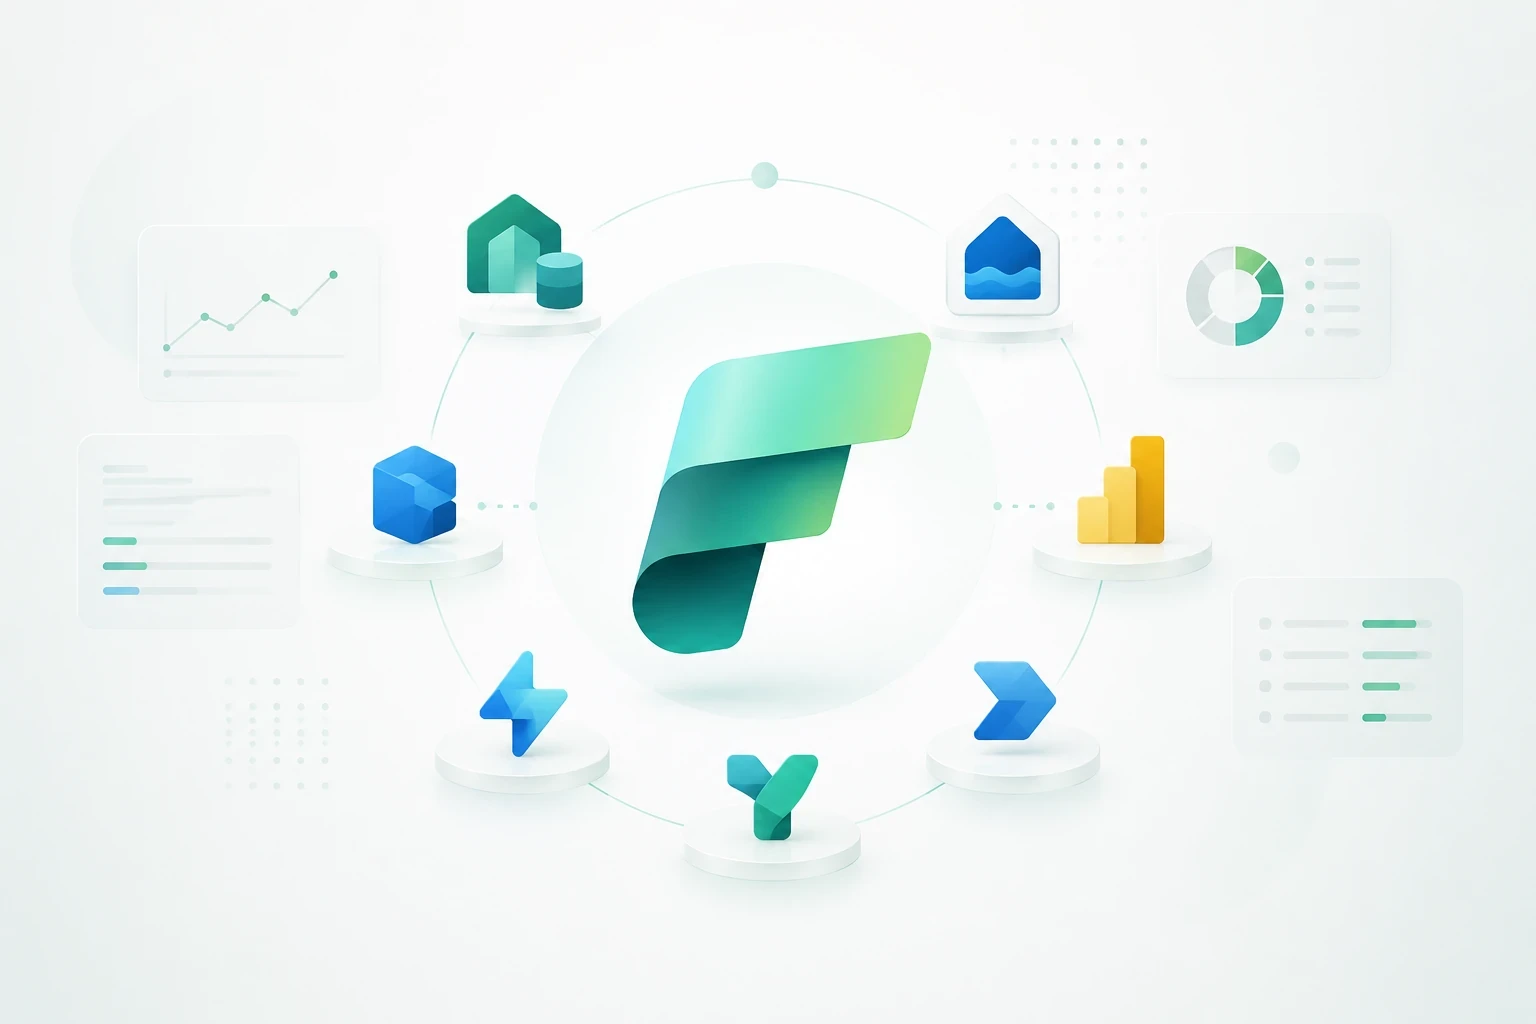
What is Microsoft Fabric? The complete explanation for businesses
Introduction
Microsoft Fabric is one of the biggest changes within the Microsoft Data Platform in recent years. Where organizations used to use separate solutions for data integration, storage, transformation, machine learning, and reporting, Fabric brings these components together in an integrated analytics platform.
For many businesses, that sounds attractive, but also abstract. Because what does Fabric mean in practice? Is it a replacement for Power BI? Is it the same as Azure Synapse? And when is it smart to start with it?
In this blog, we explain what Microsoft Fabric is, how the platform works, and why it is especially interesting for organizations that want to get more grip on their data foundation.
1. What is Microsoft Fabric?
A platform for the complete data chain
Microsoft Fabric is a SaaS platform for data and analytics. It supports the complete data chain: retrieving data from source systems, storing, transforming, modeling, analyzing, and visualizing data in Power BI.
The main difference with a traditional data architecture is that Fabric brings multiple workloads together in a central environment. Data engineers, BI specialists, data scientists, and business users therefore more often work from the same basis.
Component | What do you use it for? |
Data Factory | Retrieving, moving, and transforming data from different sources. |
Data Engineering | Lakehouses, notebooks, and Spark workloads for technical data processing. |
Data Warehouse | SQL-based analytics for structured business data. |
Real-Time Intelligence | Streaming data, events, and real-time monitoring. |
Power BI | Dashboards, reports, and semantic models for end users. |
OneLake | A central, logical data layer for analytical data. |
Why this is important
Over the years, many organizations have built up a data landscape with separate databases, Excel files, reports, exports, and ETL processes. This creates duplicate definitions, manual maintenance, and discussions about which figures are correct.
Fabric tries to reduce that fragmentation by bringing data, management, and analytics closer together. The platform does not automatically solve all data problems, but it does offer a strong foundation to work more structuredly.
2. Why did Microsoft develop Fabric?
From separate tools to an integrated platform
Most organizations want to steer faster on data, but the technical reality is often complex. There are source systems such as ERP, CRM, finance software, and operational applications. On top of that are data warehouses, data lakes, reports, and self-service dashboards.
Microsoft Fabric was developed to reduce that complexity. The platform combines components that were previously separate, such as data integration, data engineering, warehousing, and Power BI.
· Less duplication: data needs to be copied less frequently between different tools.
· More coherence: teams work from shared workspaces, domains, and semantic models.
· Faster development: business questions can be translated into usable dashboards more quickly.
· Better governance: access, lineage, and classification become more manageable within one platform.
3. What is OneLake?
The central data layer of Fabric
OneLake is often described as the OneDrive for data. The idea is that every Fabric tenant automatically has a central, logical data lake in which lakehouses, warehouses, and other data items come together.
Instead of constantly copying data to another storage location, different workloads can use the same data. That makes it easier to build a common data foundation.
Why OneLake is strategic
For businesses, OneLake is especially interesting because it helps to centralize data without losing all flexibility. Finance, sales, operations, and management can each have their own analyses, while the underlying data remains more manageable.
This does not mean you should just put everything in OneLake. A good setup still requires clear domains, naming conventions, security, ownership, and quality control.
4. How does Microsoft Fabric work in practice?
An example from source to dashboard
Suppose an organization wants to combine sales data from an ERP system, customer data from CRM, and budget data from Excel. In a traditional environment, these sources are often brought together with separate scripts or manual exports.
1. Step 1: Data Factory retrieves data from ERP, CRM, and files.
2. Step 2: Data Engineering processes and standardizes the data in a lakehouse.
3. Step 3: The Data Warehouse or semantic model makes the data suitable for analysis.
4. Step 4: Power BI displays dashboards for management, finance, and sales.
5. Step 5: Security and governance determine who is allowed to see which data.
The result is not just a dashboard, but a reusable data layer. New reports then do not have to be built from scratch every time.
5. Microsoft Fabric versus traditional data platforms
What really changes?
Traditional approach | Microsoft Fabric approach |
Separate ETL tooling, separate storage, and separate BI | Integrated SaaS environment for data and analytics |
A lot of copying data between systems | OneLake as a central logical data layer |
Building reports per department | Shared semantic models and domains |
Governance often set up after the fact | Governance and security closer within the platform |
Technical teams manage a lot of infrastructure | More focus on data value and less on management |
The biggest change is not in a single feature, but in the way of working. Fabric forces organizations to think about central definitions, shared datasets, and scalable management.
6. When is Microsoft Fabric interesting?
Typical signs that Fabric can add value
· A lot of manual reporting work: teams structurally spend time on exports, copy-paste work, and checks.
· Discussion about KPI definitions: departments use different figures for revenue, margin, or inventory.
· Growing Power BI environment: many reports are created, but there is little central control over models and access.
· Complex data sources: data comes from ERP, CRM, finance, operations, and external systems.
· Ambition for AI and Copilot: AI only works reliably when the underlying data is correct and well-described.
Fabric is especially strong when an organization does not just want loose dashboards, but wants to establish a future-proof data platform.
7. What should you look out for during implementation?
Technology is not the biggest risk
The pitfall with Fabric is that organizations start building too quickly. This provides speed in the beginning, but can later lead to workspace sprawl, duplicate models, unclear ownership, and rising costs.
· Start with architecture: determine how domains, workspaces, lakehouses, and semantic models are set up.
· Define ownership: make clear who is responsible for data, definitions, and access.
· Steer on adoption: train users and make agreements about self-service BI.
· Monitor costs: Fabric capacity must match usage, performance, and growth expectations.
· Ensure data quality: no platform automatically makes poor source data reliable.
8. How QUIKK helps with Microsoft Fabric
From complexity to actionable insights
QUIKK helps organizations turn complex data into clear insights. That does not start with the dashboard, but with a reliable data foundation.
We support in designing the right architecture, setting up data warehouses and lakehouses, building Power BI dashboards, and improving existing reporting environments.
· Implementation: from initial Fabric setup to working dashboards and data models.
· Migration: from existing reporting environments to Power BI and modern data foundations.
· Data Engineering: combining, structuring, and automating sources.
· Power BI Consulting: developing dashboards that align with real decisions.
· Training: teaching users how to work better with data and Power BI themselves.
Conclusion
Microsoft Fabric is not a simple tool, but a strategic platform for organizations that want to modernize their data foundation. Value is created when OneLake, data engineering, governance, and Power BI are set up together around clear business goals.
Want to know if Microsoft Fabric fits your organization? QUIKK helps you quickly clarify where the opportunities lie, which architecture makes sense, and how to get from data to actionable insights.
Sources consulted
· Microsoft Learn - What is Microsoft Fabric: https://learn.microsoft.com/en-us/fabric/fundamentals/microsoft-fabric-overview
· Microsoft Learn - OneLake overview: https://learn.microsoft.com/en-us/fabric/onelake/onelake-overview
· Microsoft Learn - Fabric terminology: https://learn.microsoft.com/en-us/fabric/fundamentals/fabric-terminology
· Microsoft Learn - Fabric for Power BI users: https://learn.microsoft.com/en-us/power-bi/fundamentals/fabric-get-started
· QUIKK - Power BI Consulting: https://www.quikkdata.com/