
Construction & Technology
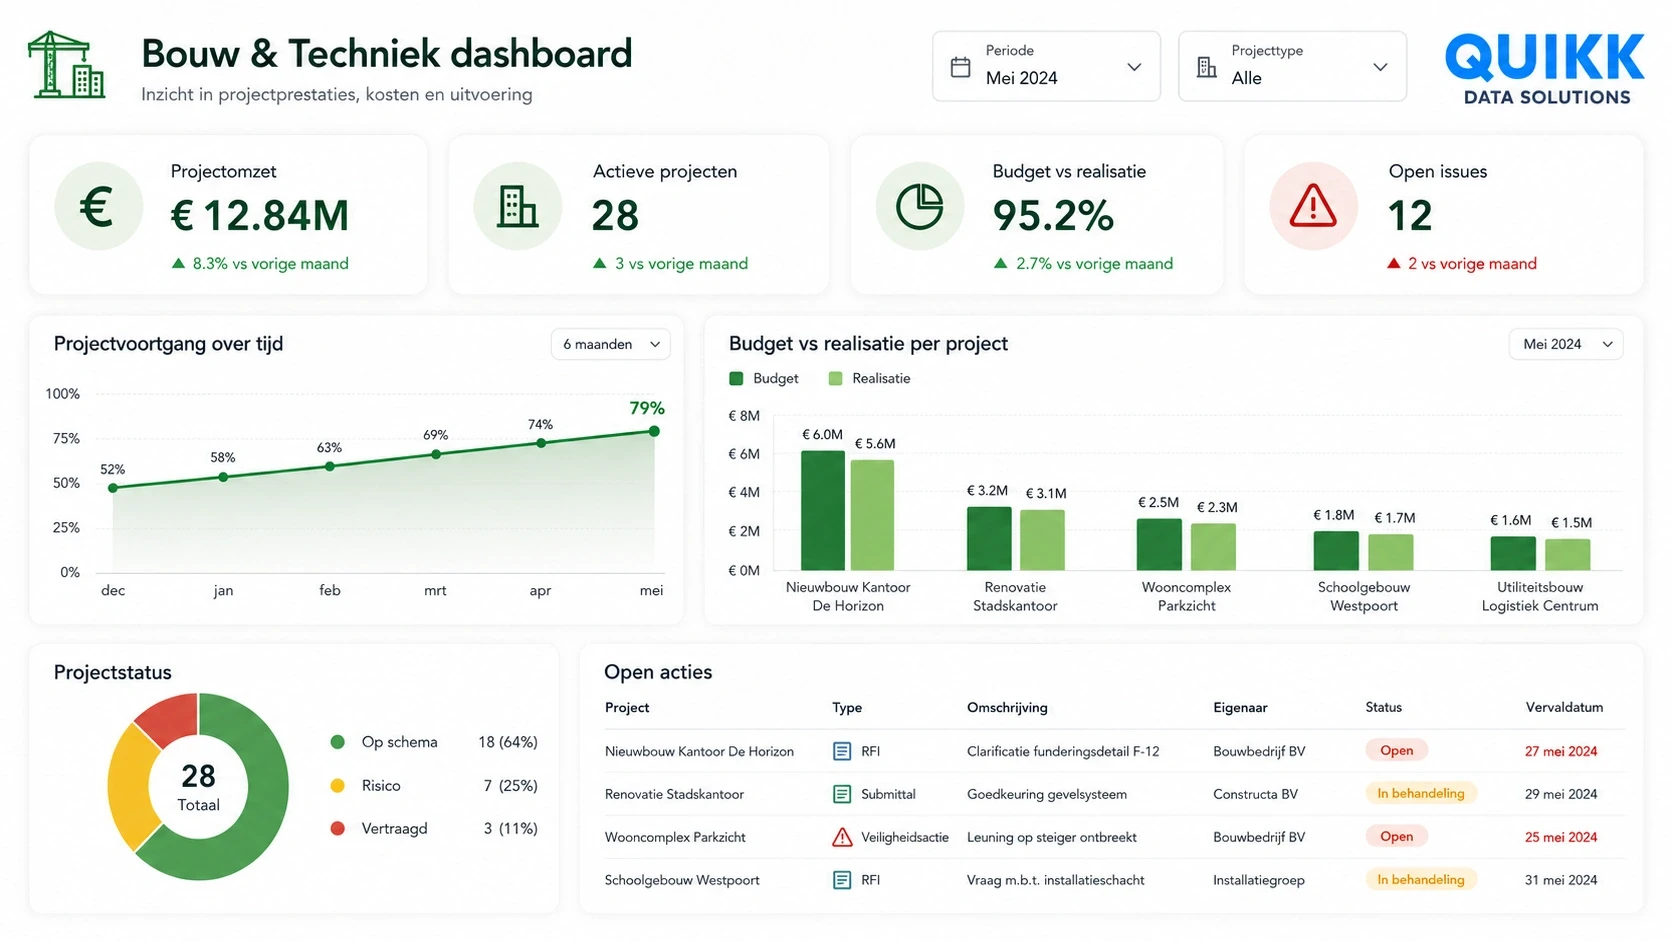
The data is there, but it is scattered across your project administration, time tracking, purchasing, and finance. We bring it together into reliable management information that is available on time.
All sources connected & automatically refreshed
One truth for finance, project management, and board of directors
Real-time insight into margin, hours, and project progress



Already developed 300+ solutions for, among others,










recognizable?
For drivers who look ahead.
My system does not scale with me. Projects are getting larger, margins are getting tighter, and clients expect insights faster and faster. Yet many construction and engineering companies still rely on Excel files, separate administrative processes, and reports that are only compiled after the fact.
Information is scattered. Hours, revenue, customer performance, project progress and financial results are often scattered across multiple systems. As a result, it takes a lot of time to determine where a project stands and which actions are needed.
recognizable?
Common challenges in manufacturing.
Information scattered. Project, revenue, and financial information is scattered across systems and Excel files.
Manual. Reports are compiled and checked manually.
Information too late. Up-to-date insight into revenue, customer performance, and trends is lacking.
Multiple truths. Finance and management do not always work with the same figures.
Repetitive work. Employees spend a lot of time on repetitive administrative tasks.
Combining is difficult. Project data is difficult to combine with financial data.
Data poverty. Dashboards do not align well with the actual information needs.
The impact: too much administration, too little management information
Reactive adjustments. When reporting requires a lot of manual work, reports are often delivered later than desired. This leaves little room to make timely adjustments regarding turnover, customer performance, or project results. Furthermore, valuable time is lost in collecting and checking, when that time could be better spent on analysis and improvement.
The impact. For construction and engineering companies, this is extra relevant because projects often consist of multiple layers: calculation, planning, execution, administration, invoicing, and reporting. If that information does not come together properly, it creates noise in the management.








solutions
Practical examples.
De Vries Trappen worked with a Qlik Sense environment for financial reporting that no longer met the growing need for information. In addition, employees relied on manual Excel processes to gather, verify, and report sales information.
We built a new Power BI environment and connected it directly to Exact Online. As a result, financial data is automatically made available for analysis and reporting. The dashboards provide insight into revenue, revenue per customer, trends, and developments over various periods.
The result: 90% time savings in gathering financial sales information, 2 FTE less administrative work, no more manual Excel reports, and real-time insight into revenue development and customer performance.
solutions
Solutions for construction & technology.
Our method.
Our approach is no coincidence. It is the result of years of experience working on projects at a wide variety of organizations. We know where processes get stuck and have designed every step so that you see quick results without unnecessary detours. This is how we make efficient use of your time and ours, delivering a dashboard you can rely on from day one.

How much does it cost to replace our Excel reports with Power BI?
That depends on how many sources need to be linked and how scattered your project and financial data currently is. We start with the reporting that currently takes up the most time or causes the most frustration and build from there, so that the investment grows along with the value.