Power BI

Say goodbye to Excel. Say goodbye to time-consuming manual reporting.

Low maintenance & automatically refreshed

Be proactive instead of reactive

Stop manual reporting

Recognizable problem?

You do everything manually in Excel.

Slow, manual, and unscalable processes. No professional dashboards or reports.

You are working with old software.

You are already working with a BI tool (Qlik or Tableau), but would like to transition to Power BI.

High administrative costs.

You want to save time and money. Make processes smarter and simpler.

Recognizable problem?

You do everything manually in Excel.

Slow, manual, and unscalable processes. No professional dashboards or reports.

You are working with old software.

You are already working with a BI tool (Qlik or Tableau), but would like to transition to Power BI.

High administrative costs.

You want to save time and money. Make processes smarter and simpler.

Already developed 300+ solutions for, among others,

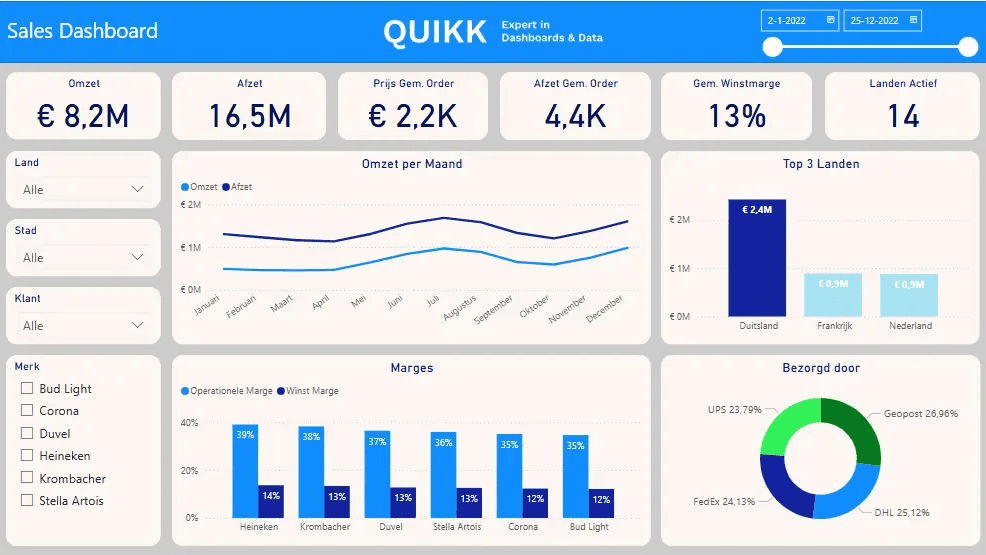
Power BI sales dashboard
Power BI HR dashboard

Power BI

What is a Power BI dashboard?

Fast and reliable. With a Power BI dashboard, you always have quick insight into your most important KPIs. Data from various sources is automatically merged into a single overview that refreshes itself. In addition to building smart KPI dashboards, we also build dashboards that allow you to perform ad-hoc analyses yourself.

All sectors. Think of a financial dashboard, HR dashboard, management dashboard, sales or marketing dashboard, or an operational dashboard, fully tailored to what your organization wants to manage.

Teams integration

Teams integration

ISO 27001

ISO 27001

Mobile app

Mobile app

Live data

Live data

Power BI

Why have a Power BI dashboard created?

More time, fewer errors. Manual reporting processes take up a lot of time and are prone to errors. We set up robust, automated dashboards that update themselves — so your people can spend their time on something more useful.

Single source of truth. Loose Excel files and different data sources quickly lead to conflicting insights. By working from a single central truth, all your reports are consistent and unambiguous.

Always and everywhere insight. Reports are no longer tied to fixed times or locations. Thanks to the cloud and the mobile app, you have access to up-to-date dashboards anytime, anywhere, and you can easily share insights with colleagues.

One truth

One truth

Always available

Always available

Fewer errors

Fewer errors

More information

More information

Tim Jeeninga and Jesper de Groot, founders of Quikk Data Solutions

cases

These companies came before you.

cases

These companies came before you.

cases

These companies came before you.

method

method

Our method.

This approach is no coincidence. It stems from years of experience with Power BI projects at a wide variety of organizations. We know where processes get stuck and have designed every step so that you see quick results without unnecessary detours. This way, we use both your time and ours efficiently, allowing you to deliver a dashboard that you can rely on from day one.

Background Image

01

Introduction

We thoroughly analyze your organization and map out your data landscape: which data sources, systems, and processes exist? We want to truly understand what you do, so that we can actively think along about what works for you.

Background Image

01

Introduction

We thoroughly analyze your organization and map out your data landscape: which data sources, systems, and processes exist? We want to truly understand what you do, so that we can actively think along about what works for you.

Background Image

02

Sketching wishes

Together with your key stakeholders, we identify the requirements for the dashboard — what is 'need to have' and what is 'nice to have'. After this phase, it is clear to everyone which data is needed and where it comes from.

Background Image

02

Sketching wishes

Together with your key stakeholders, we identify the requirements for the dashboard — what is 'need to have' and what is 'nice to have'. After this phase, it is clear to everyone which data is needed and where it comes from.

Background Image

03

Designing data model

We design the data model behind your dashboard. This is the crucial step where the reliability of your figures is determined — where necessary, we also fix the underlying data so that the numbers are actually correct.

Background Image

03

Designing data model

We design the data model behind your dashboard. This is the crucial step where the reliability of your figures is determined — where necessary, we also fix the underlying data so that the numbers are actually correct.

Background Image

04

Designing the dashboard

In parallel, we build the visual side: a professional look and feel and a super user-friendly design. A dashboard should make things easier, not harder. After delivery, you are the owner — we train your team so you can continue on your own, and we remain available whenever you need us.

Background Image

04

Designing the dashboard

In parallel, we build the visual side: a professional look and feel and a super user-friendly design. A dashboard should make things easier, not harder. After delivery, you are the owner — we train your team so you can continue on your own, and we remain available whenever you need us.

questions

questions

Frequently asked questions.

Frequently asked questions.

Which data sources can you connect to a Power BI dashboard?

A Power BI dashboard connects to more than 150 data sources, including Excel, databases, web pages, and cloud platforms. QUIKK has extensive experience with connections to Dutch software such as AFAS and Exact Online. If your data source is not supported by default, we will build a custom connector.

Can you help with the transition to Power BI from another BI tool?

Who owns the Power BI dashboard?

What does it cost to develop a Power BI dashboard?

Can we expand our Power BI dashboard ourselves?

Is Power BI suitable for SMEs?

How secure is my data in Power BI?