Government

The data is there, but it is scattered across financial systems, case management systems, and separate departmental files. We bring it together into reliable management information that is available on time.

All sources connected & automatically refreshed

One truth for finance, project management, and board of directors

Real-time insight into margin, hours, and project progress

Tim Jeeninga and Jesper de Groot, founders of Quikk Data Solutions

Recognizable problem?

Reports are always too late.

Delivery takes weeks. Adjustments can only be made after the period has already ended.

Each department has its own figures.

Systems are not aligned with each other. Debate over which number is actually correct.

Accounting for this takes hours of manual work.

Merging, checking, and reporting exports. Every single quarter.

Recognizable problem?

Reports are always too late.

Delivery takes weeks. Adjustments can only be made after the period has already ended.

Each department has its own figures.

Systems are not aligned with each other. Debate over which number is actually correct.

Accounting for this takes hours of manual work.

Merging, checking, and reporting exports. Every single quarter.

Recognizable problem?

Reports are always too late.

Delivery takes weeks. Adjustments can only be made after the period has already ended.

Each department has its own figures.

Systems are not aligned with each other. Debate over which number is actually correct.

Accounting for this takes hours of manual work.

Merging, checking, and reporting exports. Every single quarter.

Already developed 300+ solutions for, among others,

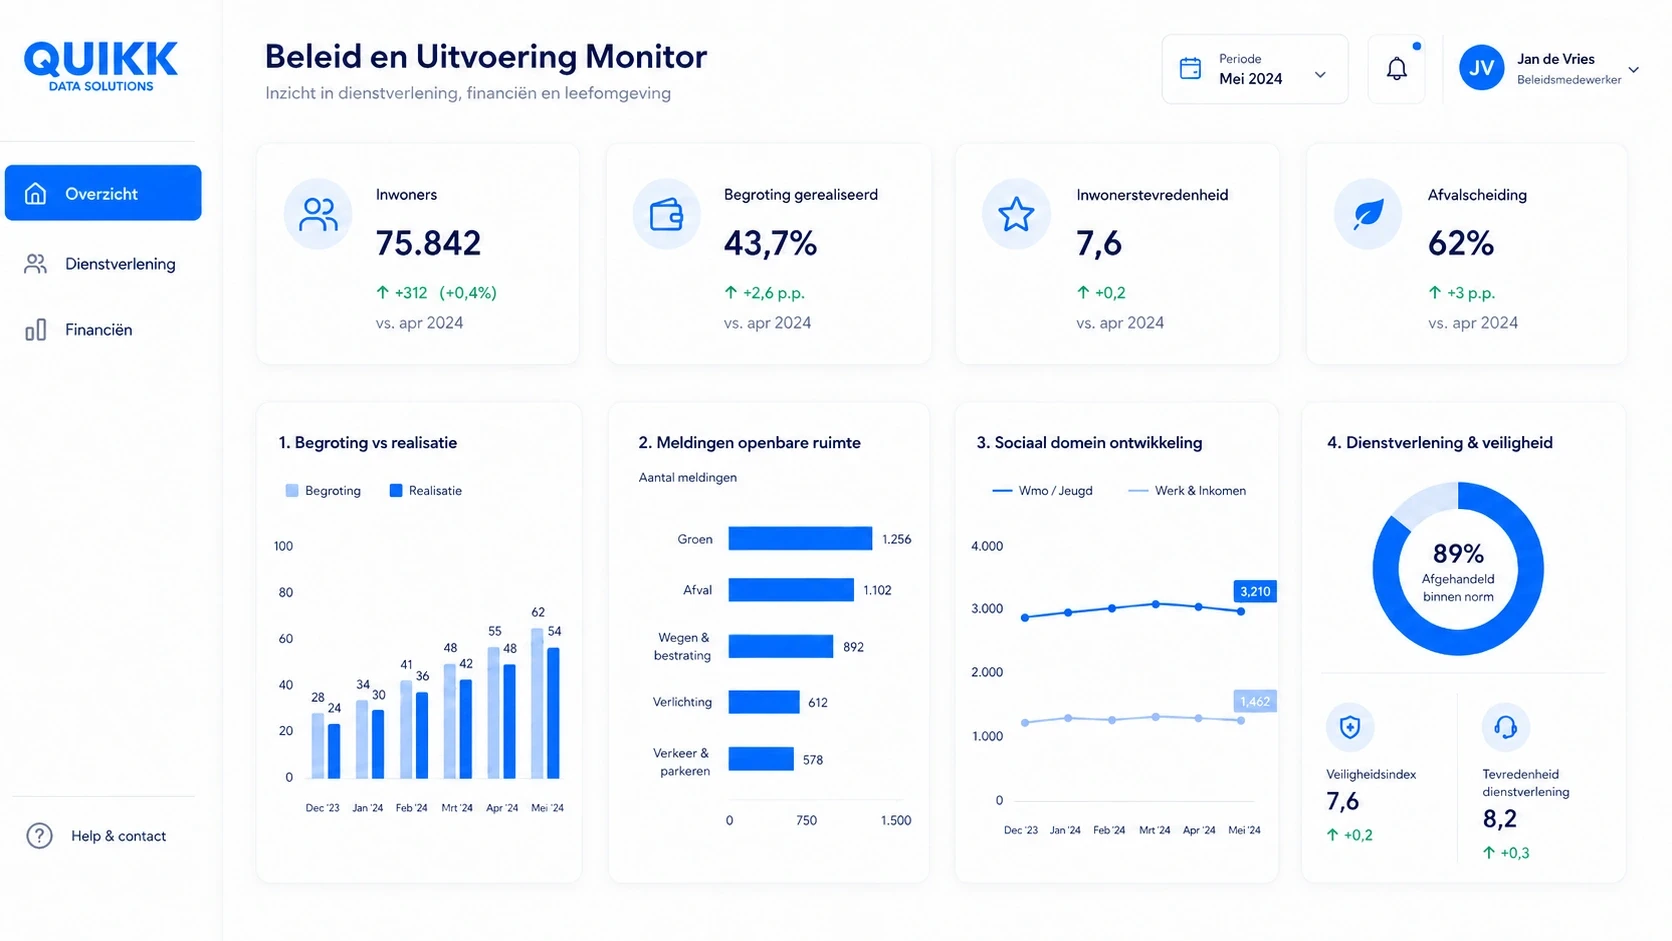
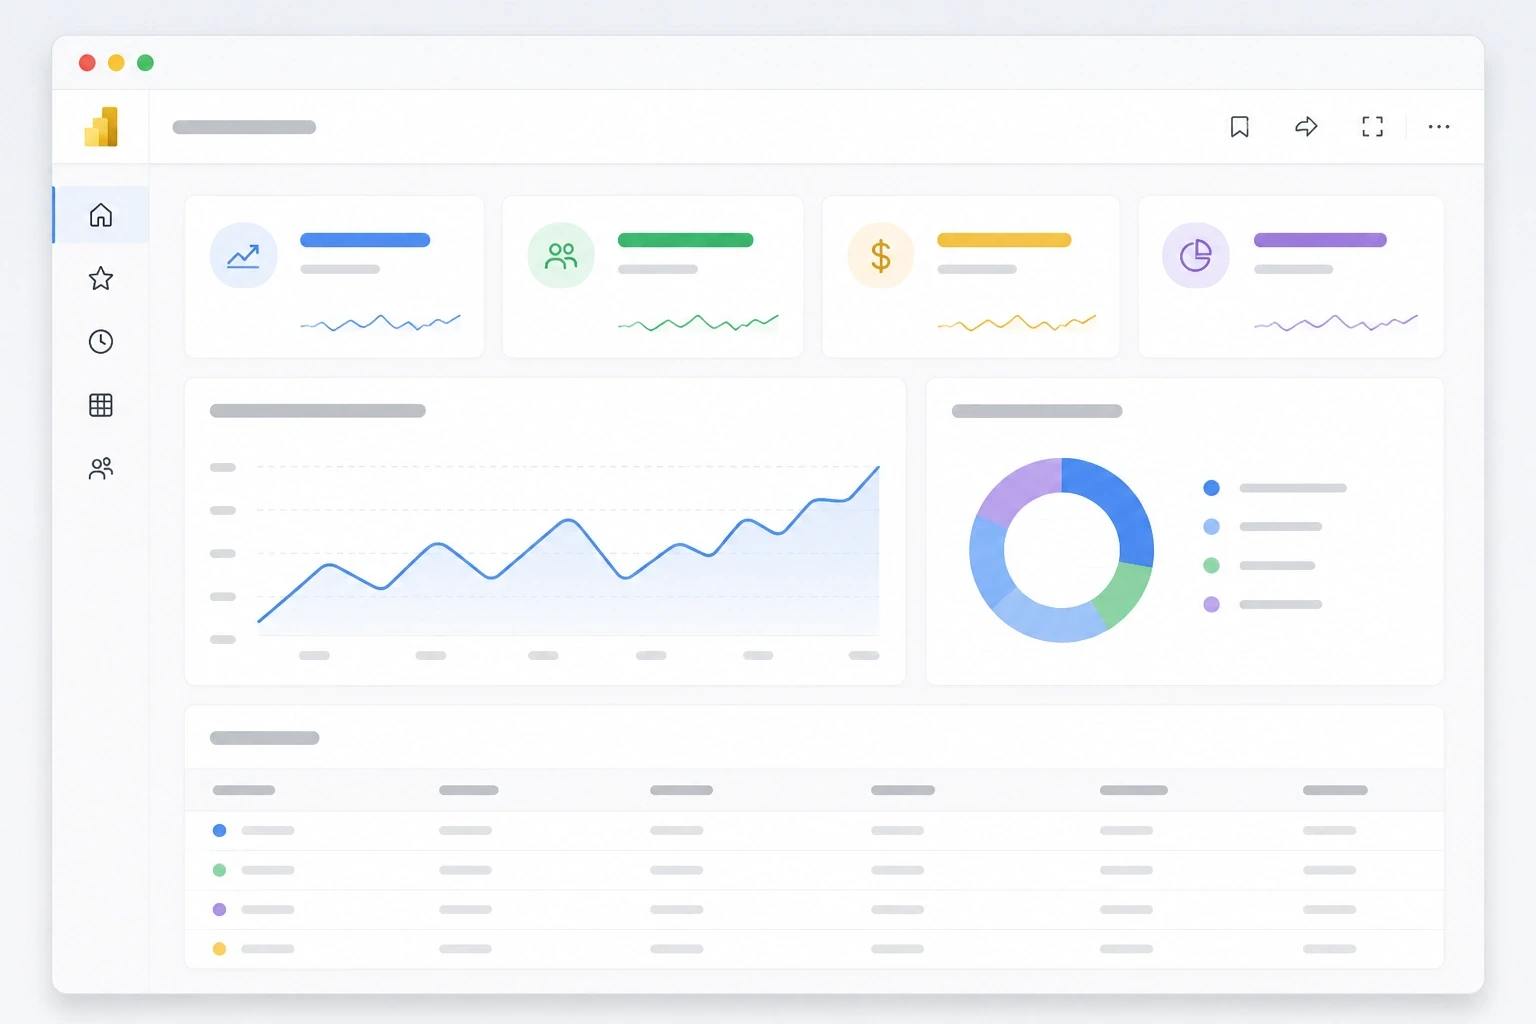
Power BI government dashboard
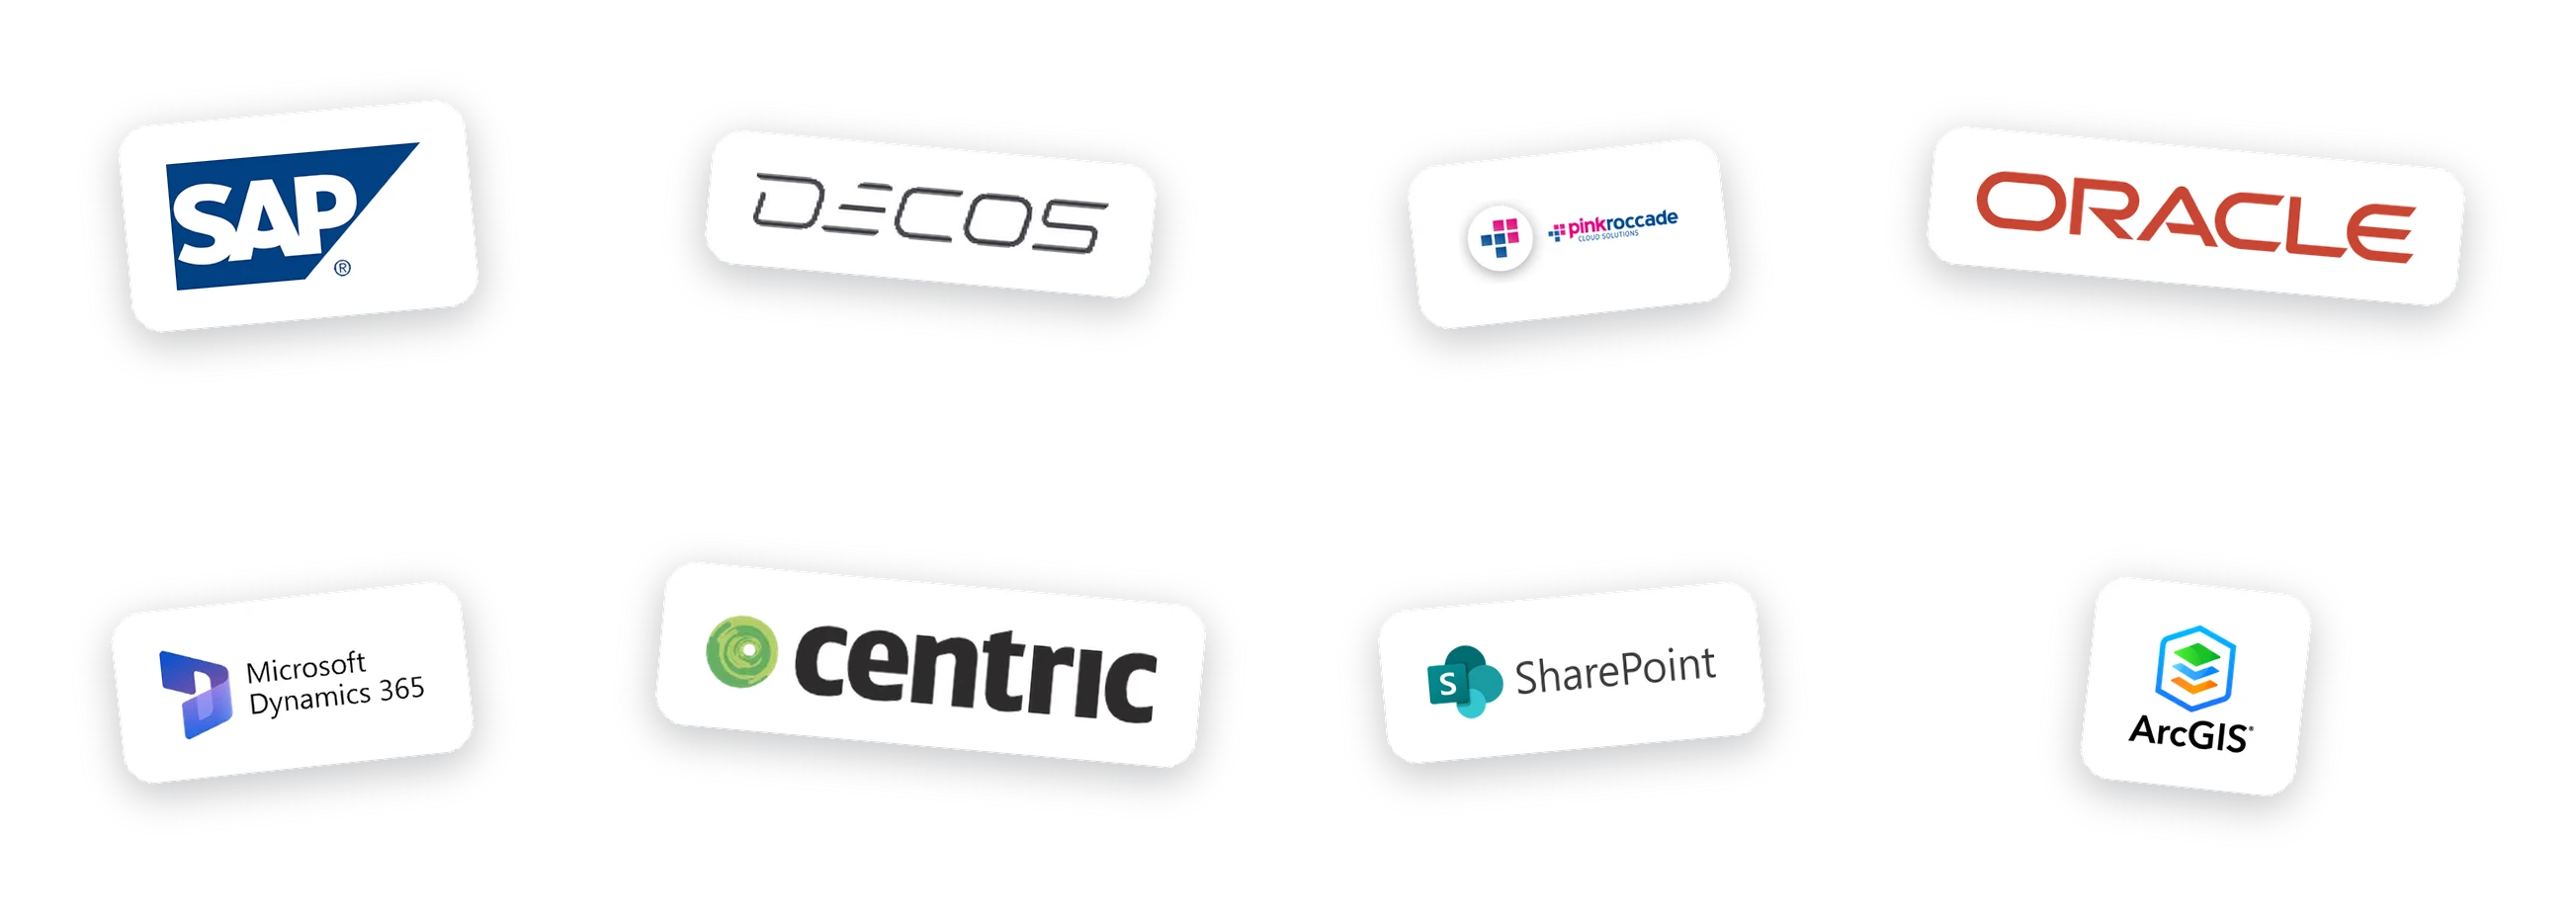
government software logos

recognizable?

For drivers who look ahead.

Reliable steering information. Government organizations possess a lot of data. Policy information, implementation data, financial data, application data, and reports are present in many places. Yet, it is often difficult to quickly turn this into reliable steering information.

One truth. The cause is usually not in a single system. Data is scattered across departments, definitions differ per team, and reports are compiled manually. As a result, it takes a lot of time to support policy and execution with up-to-date figures.

Automatic

Automatic

ISO 27001

ISO 27001

One truth

One truth

AI-ready

AI-ready

recognizable?

Common challenges for government organizations.

  • Scattered data. Data is scattered across applications, departments, and manual files.

  • Manual work. Reports are periodically compiled manually.

  • Multiple versions of the truth. Definitions of KPIs and policy indicators differ between teams.

  • Low quality. Data quality and ownership are insufficiently defined.

  • Low transparency. Dashboards do not inspire enough trust because the underlying data model is unclear.

  • Slow collaboration. Collaboration between policy, execution, finance, and IT is slowed down by data silos.

  • Foundation. New information requests take a lot of time because the foundation is missing.

The impact: less trust, slower decision-making.

High startup costs. When data is not available centrally and reliably, every new question requires a lot of work. Analysts must trace sources, verify definitions, and combine data before any insight can even be generated.

The impact. This slows down policy-making and implementation. Moreover, it creates a risk of inconsistency: different reports may provide different answers to the same question. For administration and management, this makes steering unnecessarily vulnerable.

One truth

One truth

Always available

Always available

Fewer errors

Fewer errors

More information

More information

Tim Jeeninga and Jesper de Groot, founders of Quikk Data Solutions

cases

These companies came before you.

cases

These companies came before you.

cases

These companies came before you.

groenendaal transport trucks
de vries stairs showroom

solutions

Relevant experiences.

We do not have a direct government case yet, but we do have demonstrable experience with complex data landscapes, governance, and BI modernization. In addition, we have extensive experience working in large organizations where security is paramount.

At IDA Foundation, we modernized the entire reporting landscape, migrated over 60 dashboards to Power BI, and implemented a data governance framework. Furthermore, we reduced the processing time of the data warehouse processes by 97%.

At ESKA NL, we replaced an outdated BI environment with Power BI and built a single central source of truth for financial, operational, and production data. We also resolved the discrepancies between two inventory systems, so that users could once again rely on their management information.

solutions

Solutions for government agencies.
Data Engineering

Power BI

Automation

Custom software

Automatisering van terugkerend rapportagewerk.

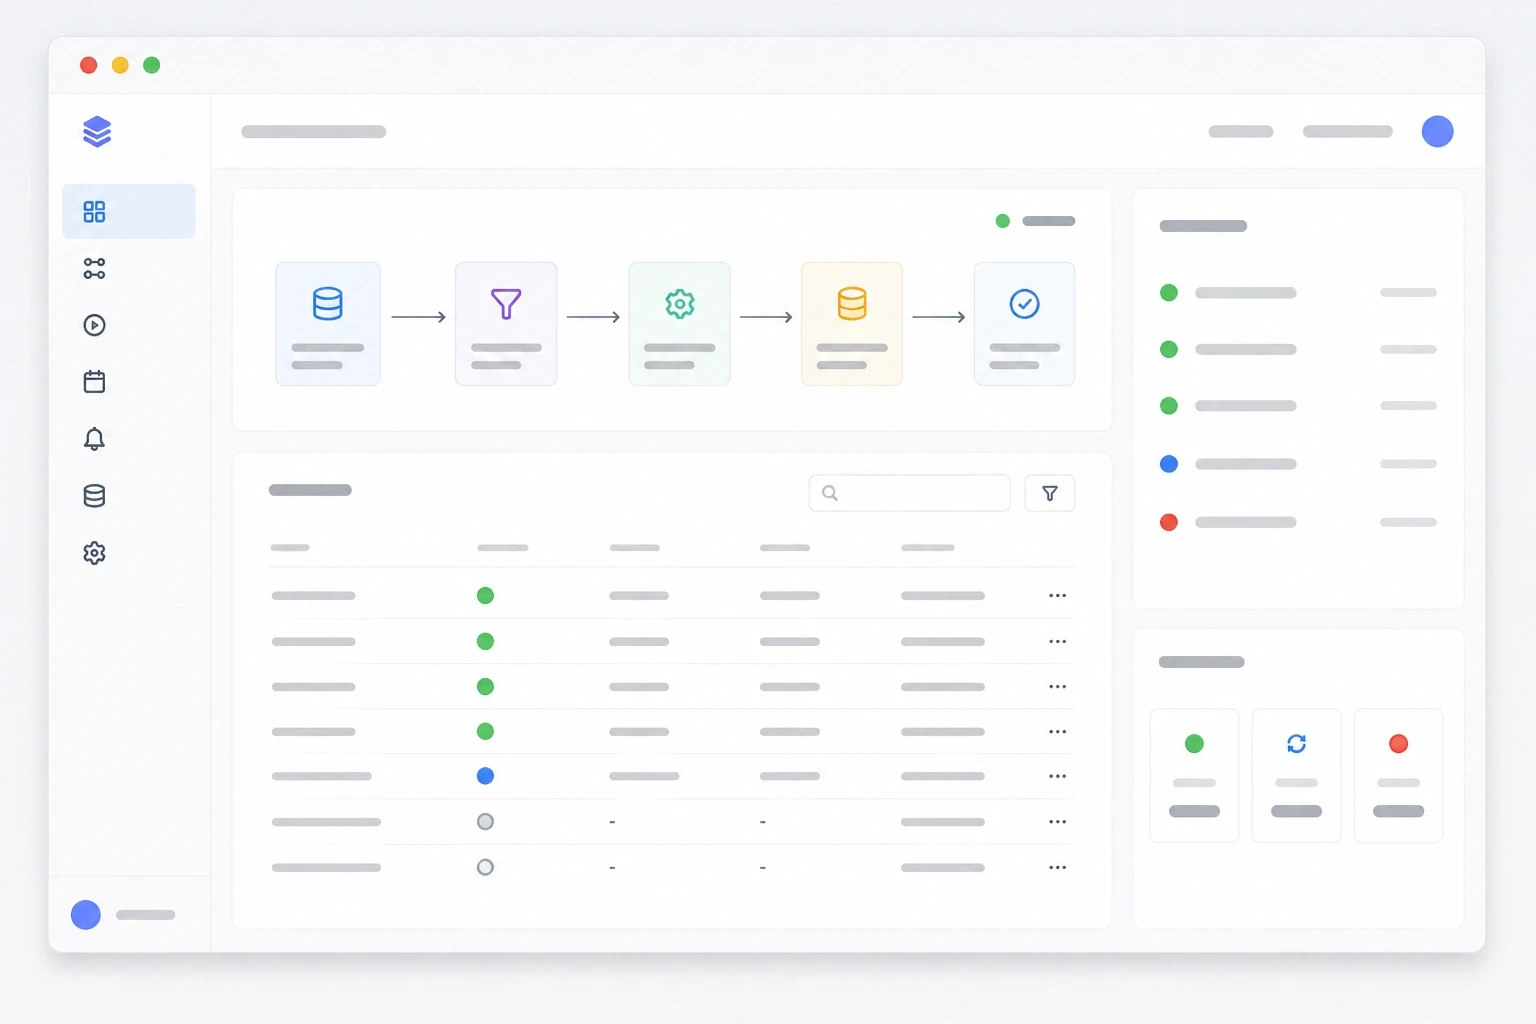
We map the existing data landscape and design an architecture where sources come together logically. In doing so, we look at data models, pipelines, data warehousing, access rights, and scalability.

Power BI dashboards for policy and implementation

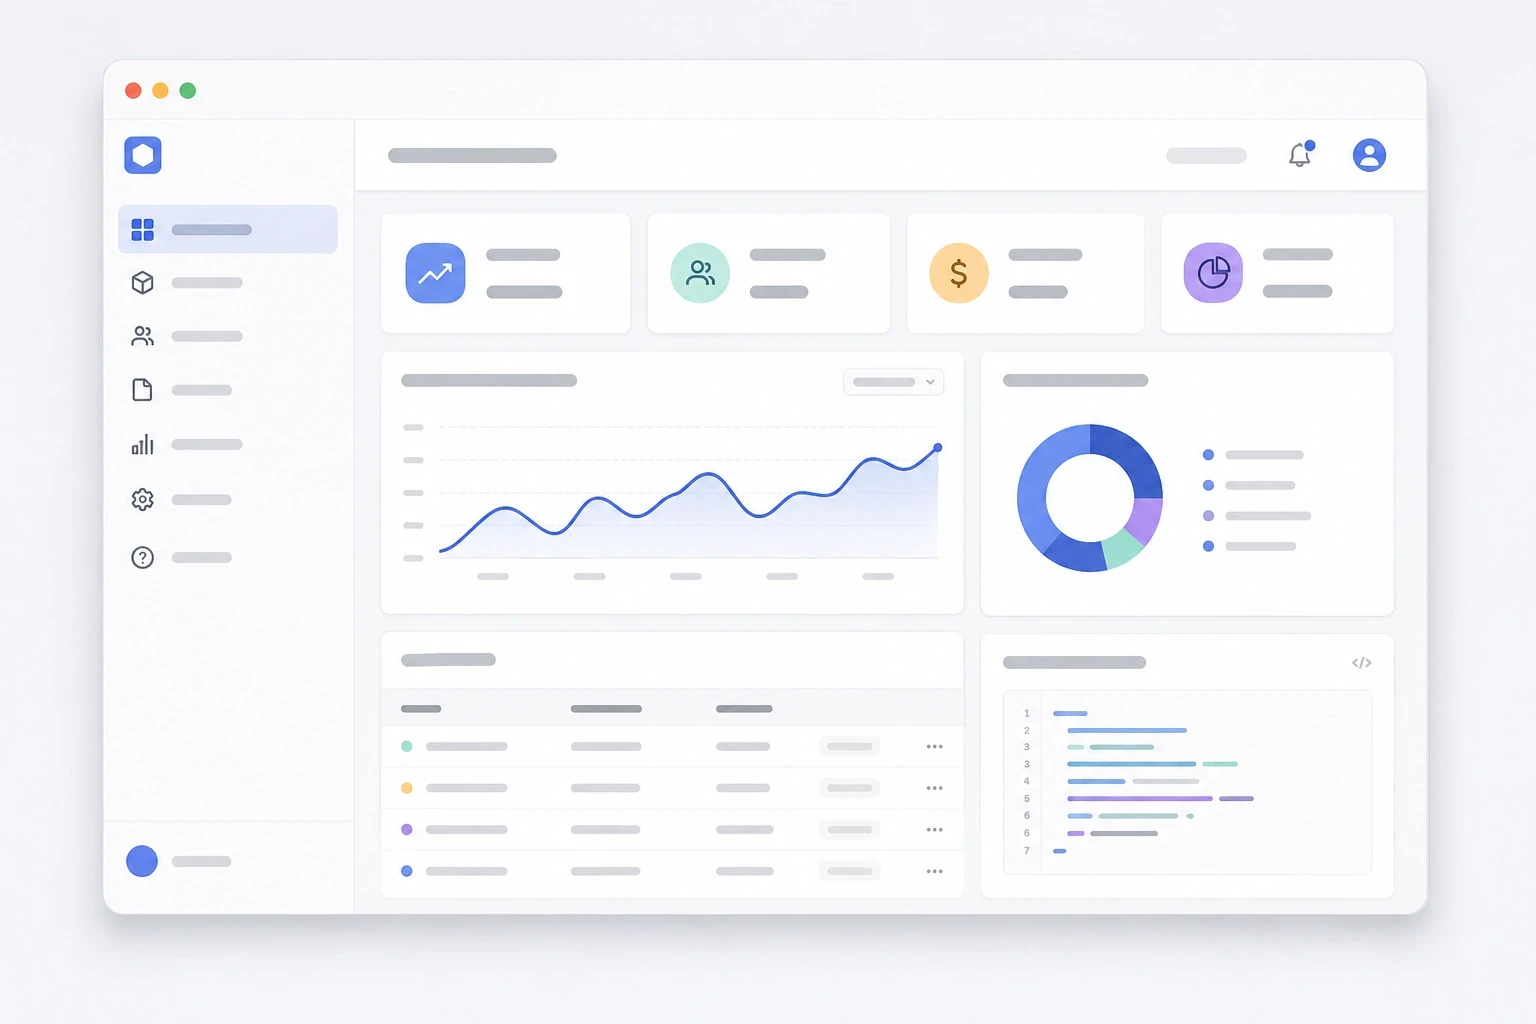
We build dashboards that align with the information needs of different user groups. Management requires different steering information than execution or analysis. That is why we design dashboards based on the user and the decision that needs to be made.

Automation of time-consuming processes

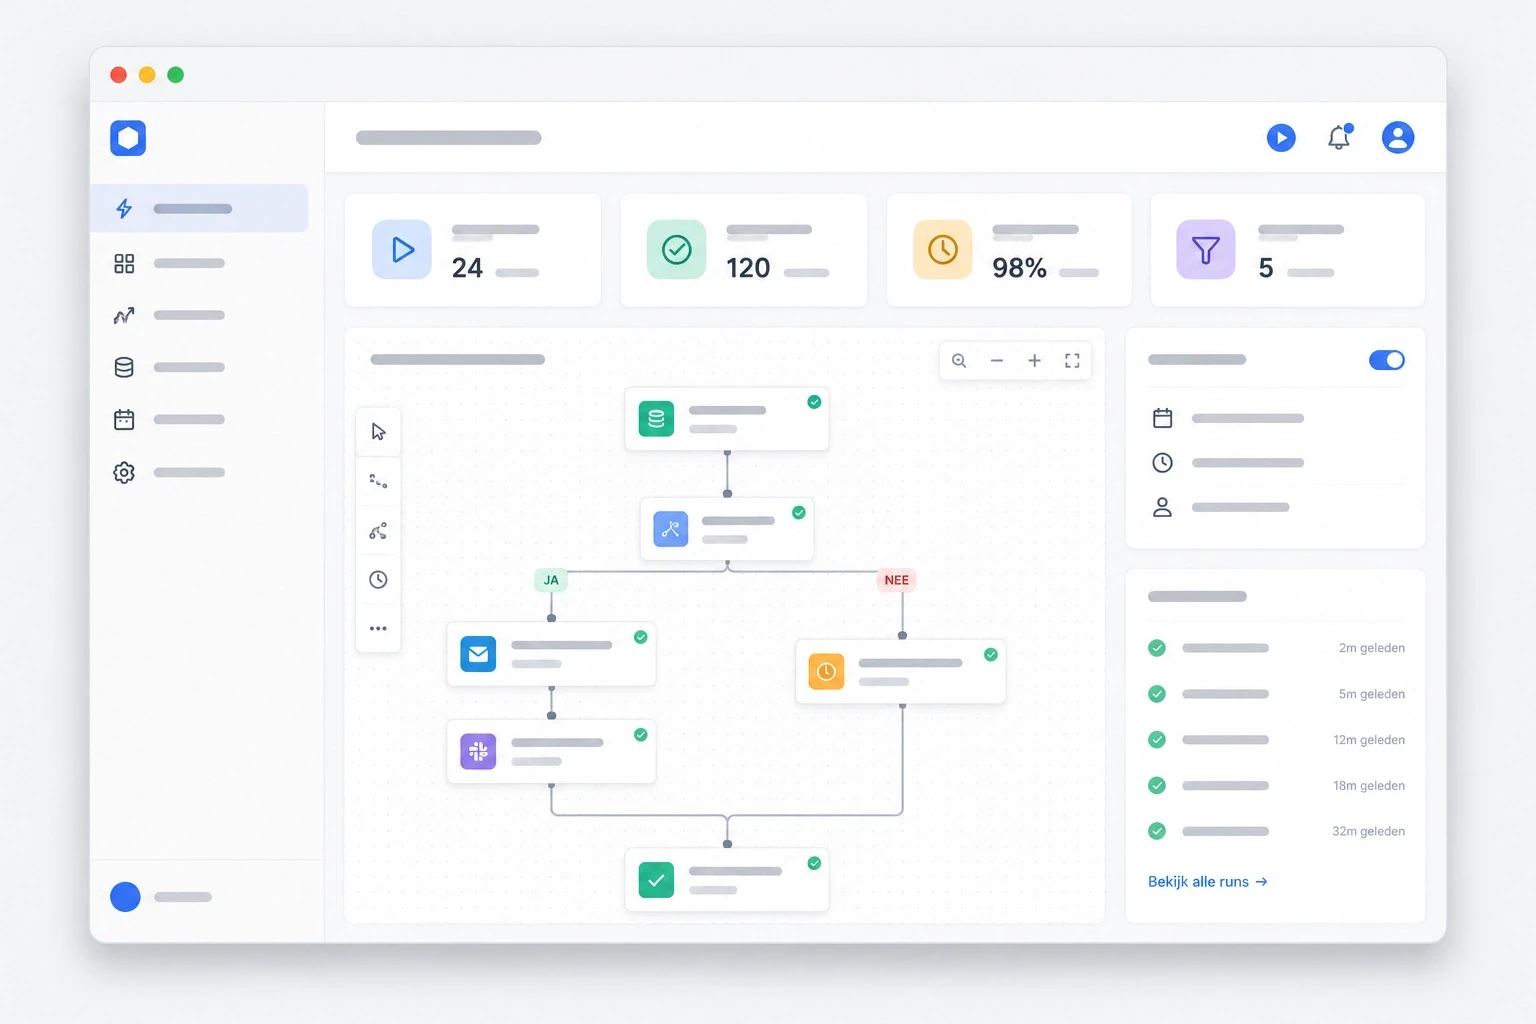
Many actions are repetitive and prone to error: transferring, checking, and sharing data between departments. We automate those steps so that employees have less manual work and information is available more quickly.

Custom software for processes that no standard package covers

Not every process fits into an existing system. We build custom solutions where it makes a difference, from a portal for data submission to a link between systems that currently do not work together. This way, the software aligns with how the organization operates.

Data Engineering

Power BI

Automation

Custom software

Power BI dashboards voor productie en management.

We map the existing data landscape and design an architecture where sources come together logically. In doing so, we look at data models, pipelines, data warehousing, access rights, and scalability.

Power BI dashboards for policy and implementation

We build dashboards that align with the information needs of different user groups. Management requires different steering information than execution or analysis. That is why we design dashboards based on the user and the decision that needs to be made.

Automation of time-consuming processes

Many actions are repetitive and prone to error: transferring, checking, and sharing data between departments. We automate those steps so that employees have less manual work and information is available more quickly.

Custom software for processes that no standard package covers

Not every process fits into an existing system. We build custom solutions where it makes a difference, from a portal for data submission to a link between systems that currently do not work together. This way, the software aligns with how the organization operates.

Data Engineering

Power BI

Automation

Custom software

Data foundation and architecture

We map the existing data landscape and design an architecture where sources come together logically. In doing so, we look at data models, pipelines, data warehousing, access rights, and scalability.

Power BI dashboards for policy and implementation

We build dashboards that align with the information needs of different user groups. Management requires different steering information than execution or analysis. That is why we design dashboards based on the user and the decision that needs to be made.

Automation of time-consuming processes

Many actions are repetitive and prone to error: transferring, checking, and sharing data between departments. We automate those steps so that employees have less manual work and information is available more quickly.

Custom software for processes that no standard package covers

Not every process fits into an existing system. We build custom solutions where it makes a difference, from a portal for data submission to a link between systems that currently do not work together. This way, the software aligns with how the organization operates.

method

method

Our method.

Our approach is no coincidence. It is the result of years of experience working on projects at a wide variety of organizations. We know where processes get stuck and have designed every step so that you see quick results without unnecessary detours. This is how we make efficient use of your time and ours, delivering a dashboard you can rely on from day one.

Background Image

01

Introduction.

In a good conversation, we map out your systems, processes, and most important steering questions. Not to come up with a solution right away, but to understand what is truly holding you back.

Background Image

01

Introduction.

In a good conversation, we map out your systems, processes, and most important steering questions. Not to come up with a solution right away, but to understand what is truly holding you back.

Background Image

02

Analysis & design.

Together we determine where the greatest value lies and what the solution should look like. We choose the approach that fits your situation and prefer to start small, with the issue that currently costs the most time or frustration.

Background Image

02

Analysis & design.

Together we determine where the greatest value lies and what the solution should look like. We choose the approach that fits your situation and prefer to start small, with the issue that currently costs the most time or frustration.

Background Image

03

Build & integrate.

We build the solution—such as a dashboard, data model, automation, or custom application—and connect it to the systems you already use. Solitly built, so it remains robust and maintainable.

Background Image

03

Build & integrate.

We build the solution—such as a dashboard, data model, automation, or custom application—and connect it to the systems you already use. Solitly built, so it remains robust and maintainable.

Background Image

04

Delivery and further development.

You will receive a working, documented solution. We will train your team and remain available as a partner for management and further development. You always stay in control.

Background Image

04

Delivery and further development.

You will receive a working, documented solution. We will train your team and remain available as a partner for management and further development. You always stay in control.

FAQ

FAQ

Frequently asked questions.

Frequently asked questions.

What does a Power BI dashboard cost for a municipality or local government?

That depends on the number of data sources, the quality of your data, and which policy areas you want to gain insight into. A dashboard based on a single source can be realized faster than a process in which data from finance, the social domain, services, and public space must first be linked. We like to start small, with the question that currently yields the most value, and build further from there. Dashboards start from 4,000 euros (excl. VAT).

How long does it take to build a government dashboard?

Can you build dashboards for the social domain, finance, and public services?

Do we as a municipality need a data warehouse, or can we build a dashboard directly?

Can you help combine municipal data from different systems?

Which KPIs can we track in a dashboard for a municipality?

Can you create dashboards for policy monitoring and implementation?

Which administrative processes can you automate for municipalities?