
Financial
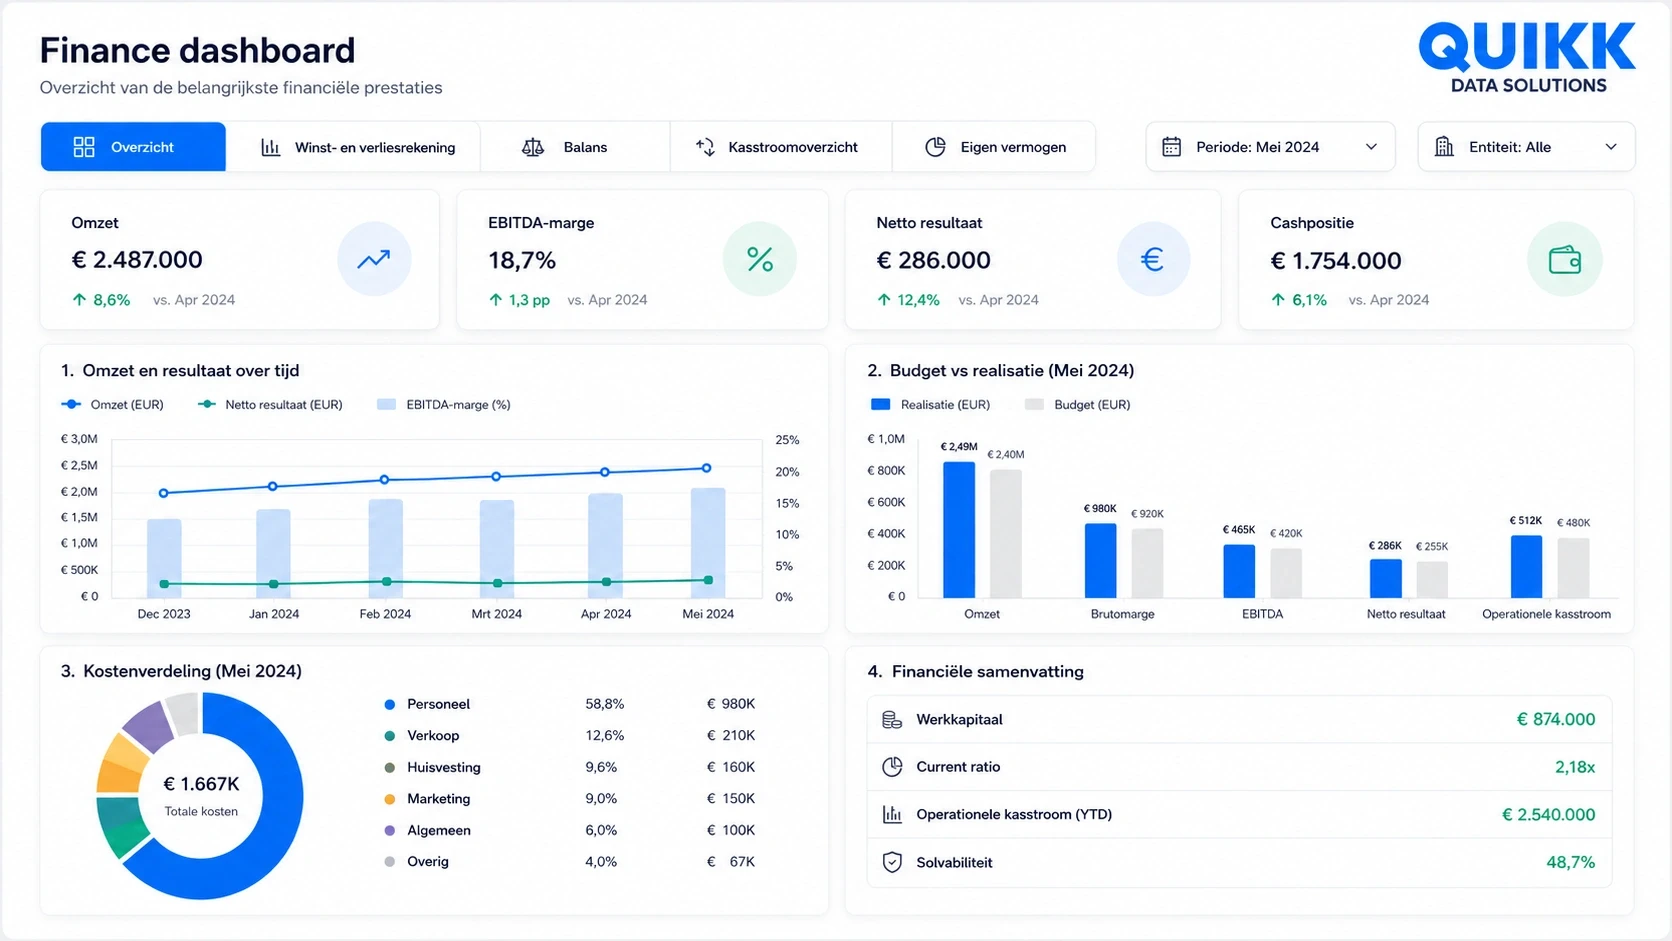
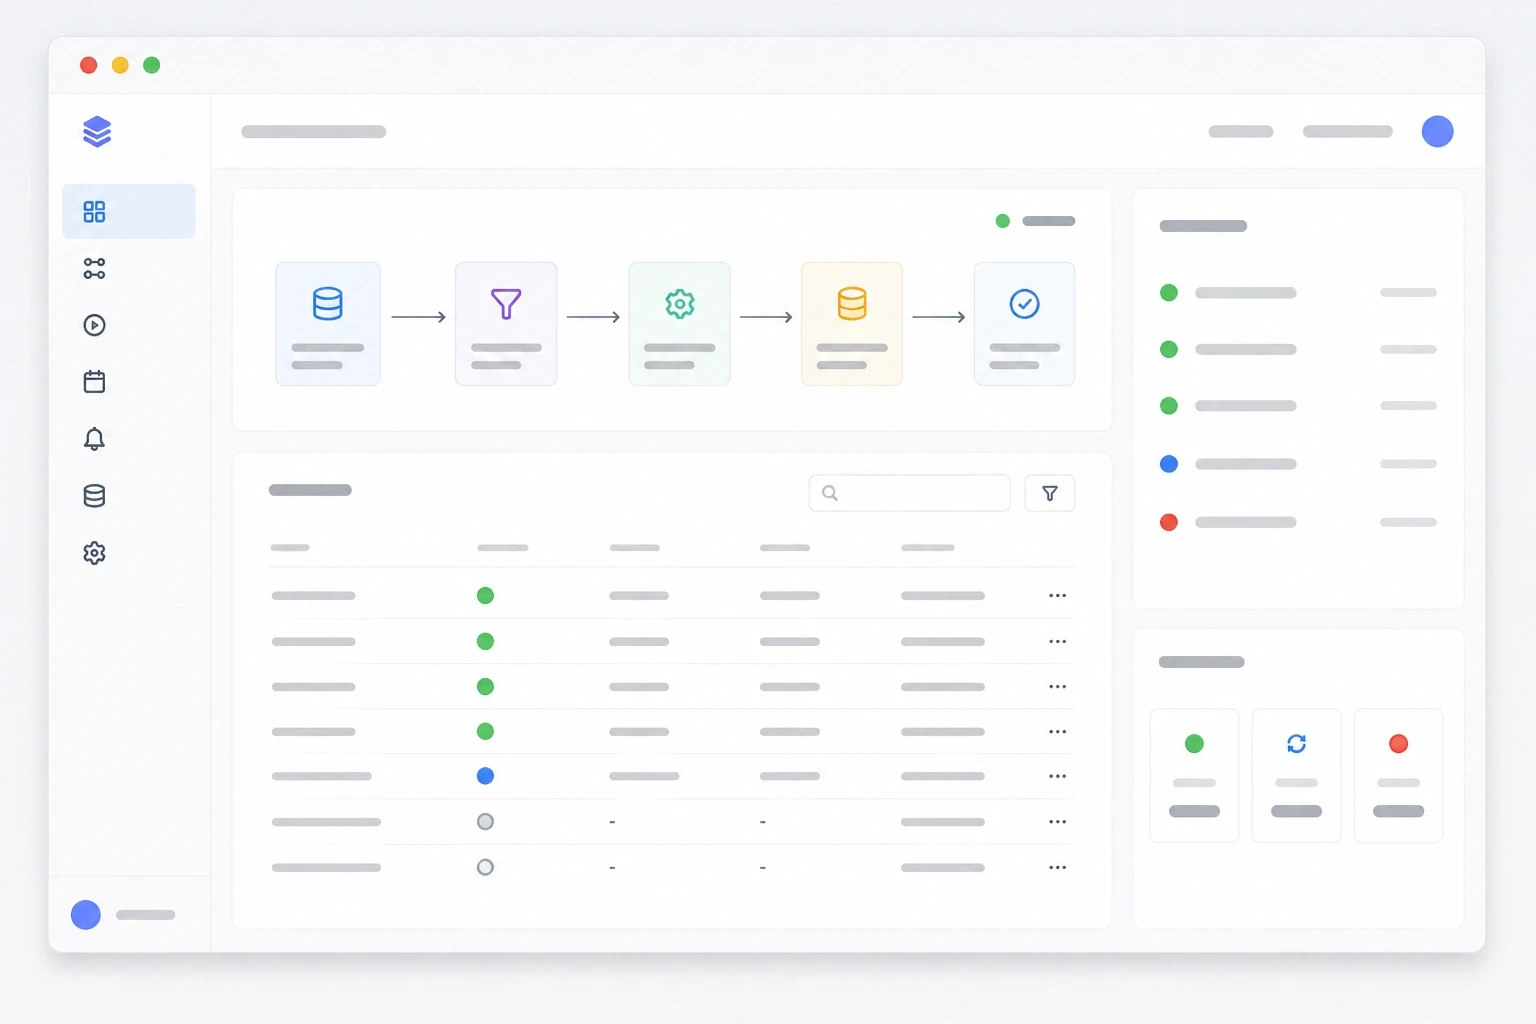
The data is there, but it is scattered across your accounting, ERP, sub-ledgers, and Excel. We bring it together into reliable management information that is available on time.
All sources connected & automatically refreshed
One truth for finance, project management, and board of directors
Real-time insight into margin, hours, and project progress




Already developed 300+ solutions for, among others,










recognizable?
For financials who look ahead.
Looking ahead. The role of finance is to look ahead, analyze, and advise. In practice, too much time is still often spent on collecting, checking, and combining data from different systems.
One truth. Every single month, exports from Exact, ERP systems, invoice processing, Excel files, and operational software come together in one single report. And just as the report is ready, it turns out that a department is working with a different figure.
recognizable?
Common challenges in finance.
Manual work. Monthly reports are compiled and checked manually.
Multiple truths. Data comes from multiple sources that do not communicate with each other automatically.
Everything in Excel. Excel files have evolved into critical reporting processes.
Time-consuming. Controllers spend too much time collecting instead of analyzing.
Outdated information. Management lacks real-time insight into revenue, margin, costs, and outstanding items.
Definitions. KPI definitions differ between departments.
Information too late. Figures are only available when the period has actually already passed.
The impact: finance remains stuck in producing reports.
Reactive adjustments. When reporting requires a lot of manual work, energy goes into delivering figures instead of understanding them. Errors are discovered late, deviations require a lot of research, and discussions arise about reliability.
The impact. Decision-making slows down. Management receives information later than desired, and finance gets less room to take on an advisory role. And that is at a time when up-to-date, reliable figures are precisely what is needed to steer effectively.











solutions
Practical examples.
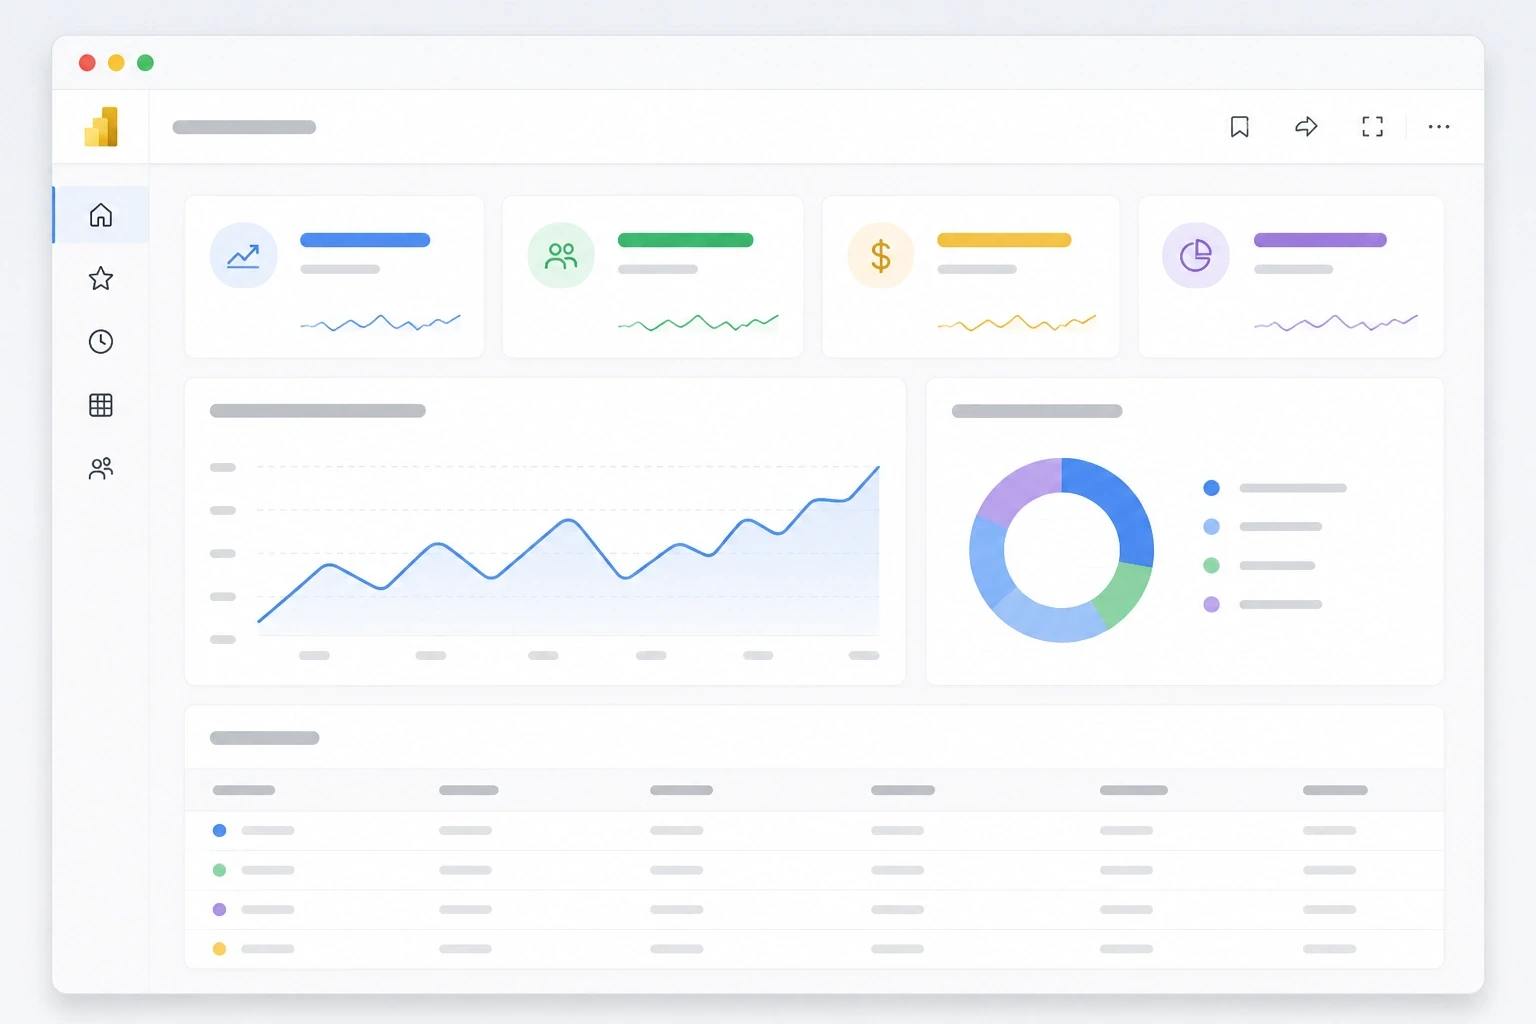
At Groenendaal Transport, QUIKK optimized the month-end closing process and developed a financial Power BI dashboard linked to Exact Online. The result was that the organization has its monthly figures 75% earlier and can adjust sooner based on current data.
At De Vries Trappen, financial data from Exact Online was automatically made available in Power BI. Manual Excel reports were eliminated, the organization saved 2 FTEs on administrative tasks, and achieved a 90% time savings in gathering sales information.
At B2 Cleaning, a Power BI environment was set up with insight into revenue, contract contribution, absenteeism, and operational KPIs. Management, regional managers, and area managers received real-time insight into their area of responsibility, resulting in a 95% time saving on analyses and reports.
solutions
Solutions for finance.
Our method.
This approach is no coincidence. It stems from years of experience working on projects at a wide range of organizations. We know where processes get stuck and have designed every step so that you see quick results without unnecessary detours. This is how we handle your time and ours efficiently, and you deliver a dashboard that you can build on from day one.

How much does it cost to automate our financial reporting?
That depends on how many systems need to be linked and what state your data is currently in. Realizing a single dashboard on a clean source is faster and cheaper than a process where finance, ERP, and invoice processing first need to be linked together. We like to start small, with the reporting that currently takes up the most time, so that the investment grows along with the value you get back.