
Production
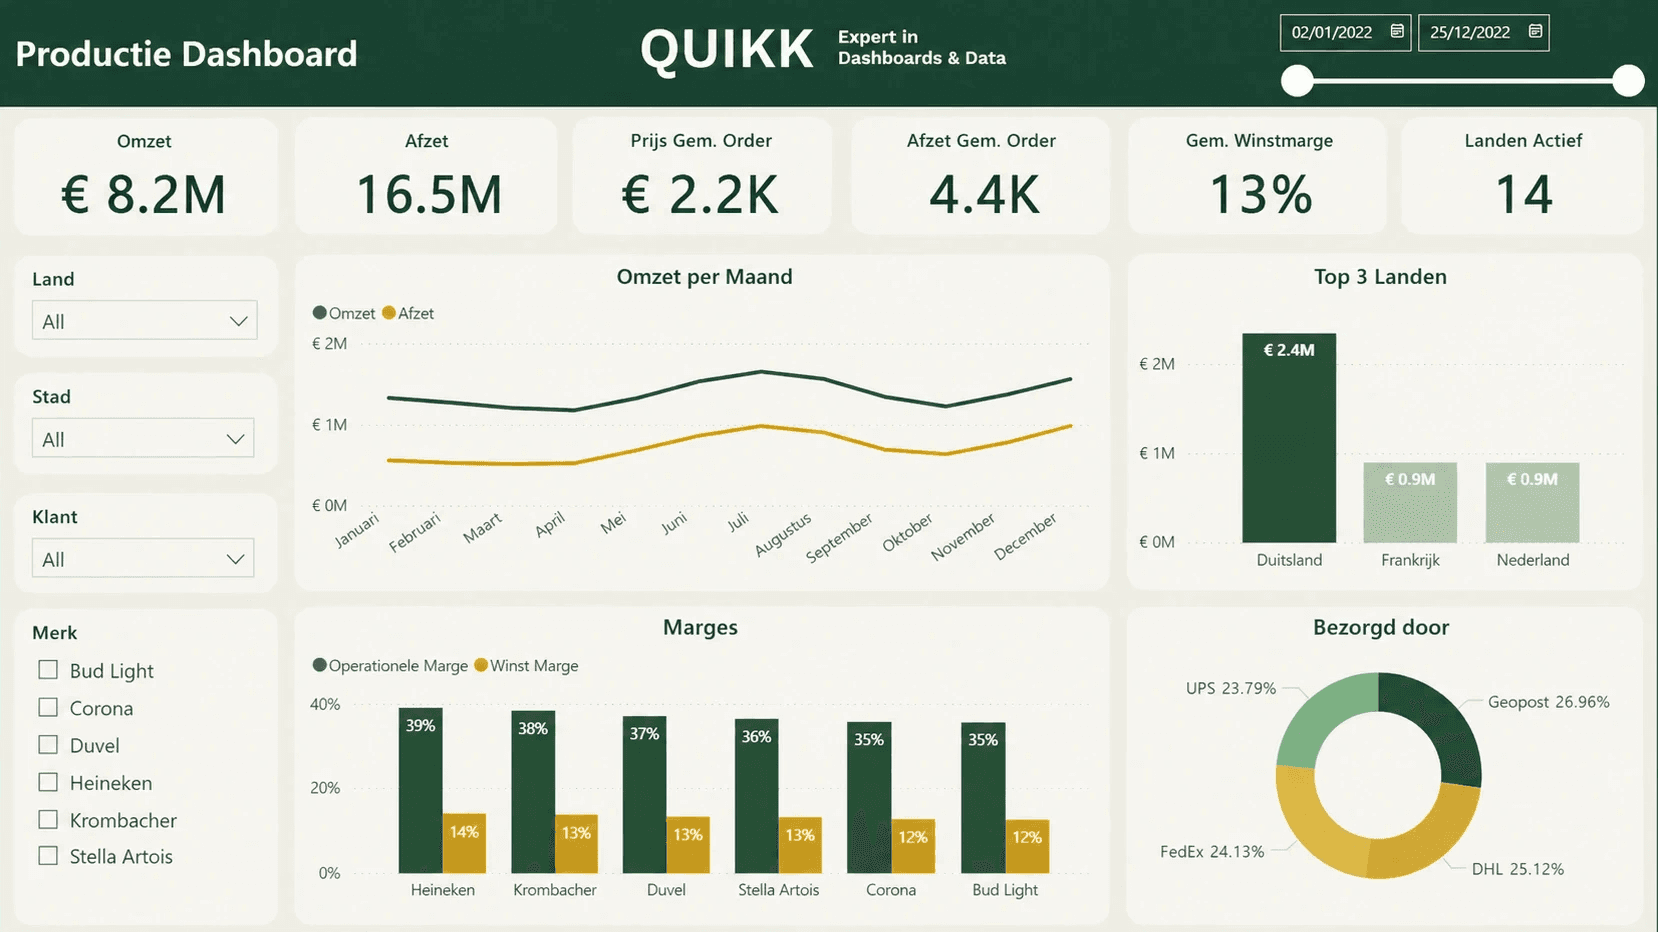
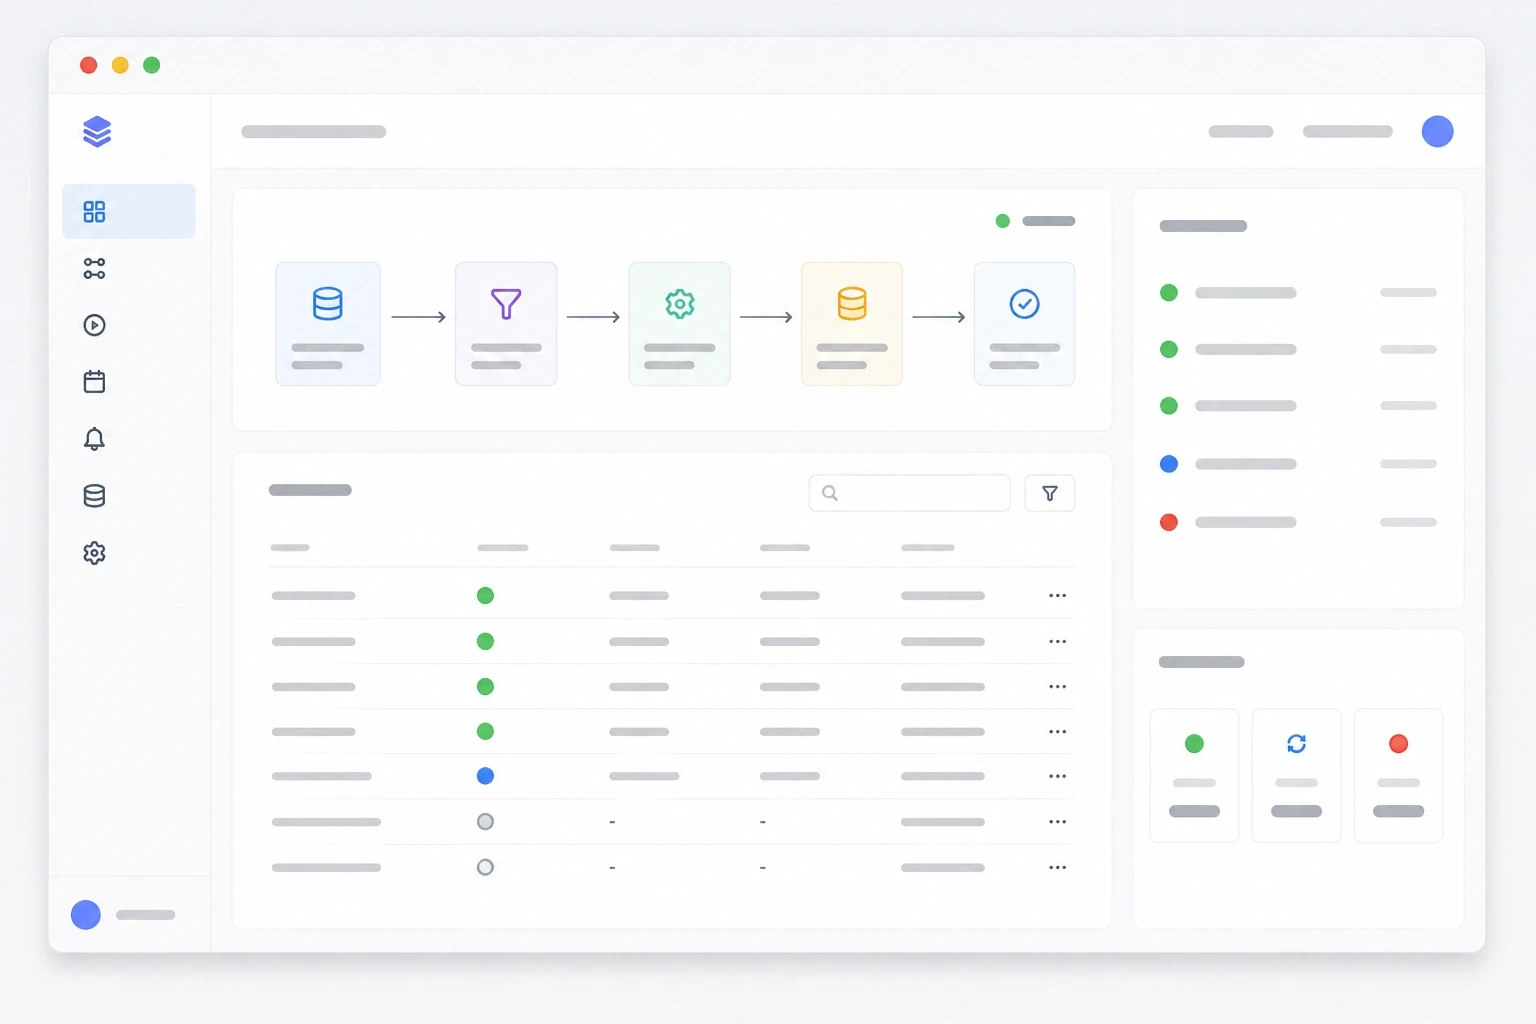
The data is there, but it is scattered across ERP, PMS, inventory systems, and accounting software. We bring it together into reliable management information that is easily accessible.
All sources connected & automatically refreshed
One truth for management and operations
Real-time insight into margin, stock, and return




Already developed 300+ solutions for, among others,











recognizable?
For manufacturing companies that want to steer better.
Manual work. Machines run, orders proceed, and systems collect data all day long. Yet many manufacturing companies still have to steer on Excel files, loose exports, and reports that only become available days or weeks later.
Noise on the line. So the data is there. It is just scattered across the ERP system, PMS, PLCs, inventory systems, and accounting software. As a result, there is no clear picture of what is actually happening on the floor, in stock, and in the margin.
recognizable?
Common challenges in manufacturing.
Scattered. Production data, inventory data, and financial figures are scattered across multiple systems.
Outdated data. KPIs such as yield, utilization, lead time, delivery reliability, and inventory are not available in real-time.
Manual work. Reports are compiled manually in Excel and are therefore prone to errors.
Definitions. Different departments use different definitions for the same KPI.
Disconnection. Inventory reports do not match reality, leading to a lack of trust in the numbers.
Outdated tools. An outdated BI environment is no longer being developed further and hinders growth.
Time-consuming. Data loading processes take too long, making dashboards slow or outdated.
The impact: adjusting too late.
Reactive adjustments. If figures are only available after the fact, making adjustments becomes reactive. You only see that margins are under pressure after the month-end closing. You only discover stock discrepancies when planning or purchasing is already affected. And your team spends time on reporting instead of making improvements.
Impact. The consequence is not just frustration. It directly affects operations: more manual work, less trust in reports, slower decision-making, and unnecessary costs due to errors, delays, or redundant inventory.








recognizable?
Practical examples.
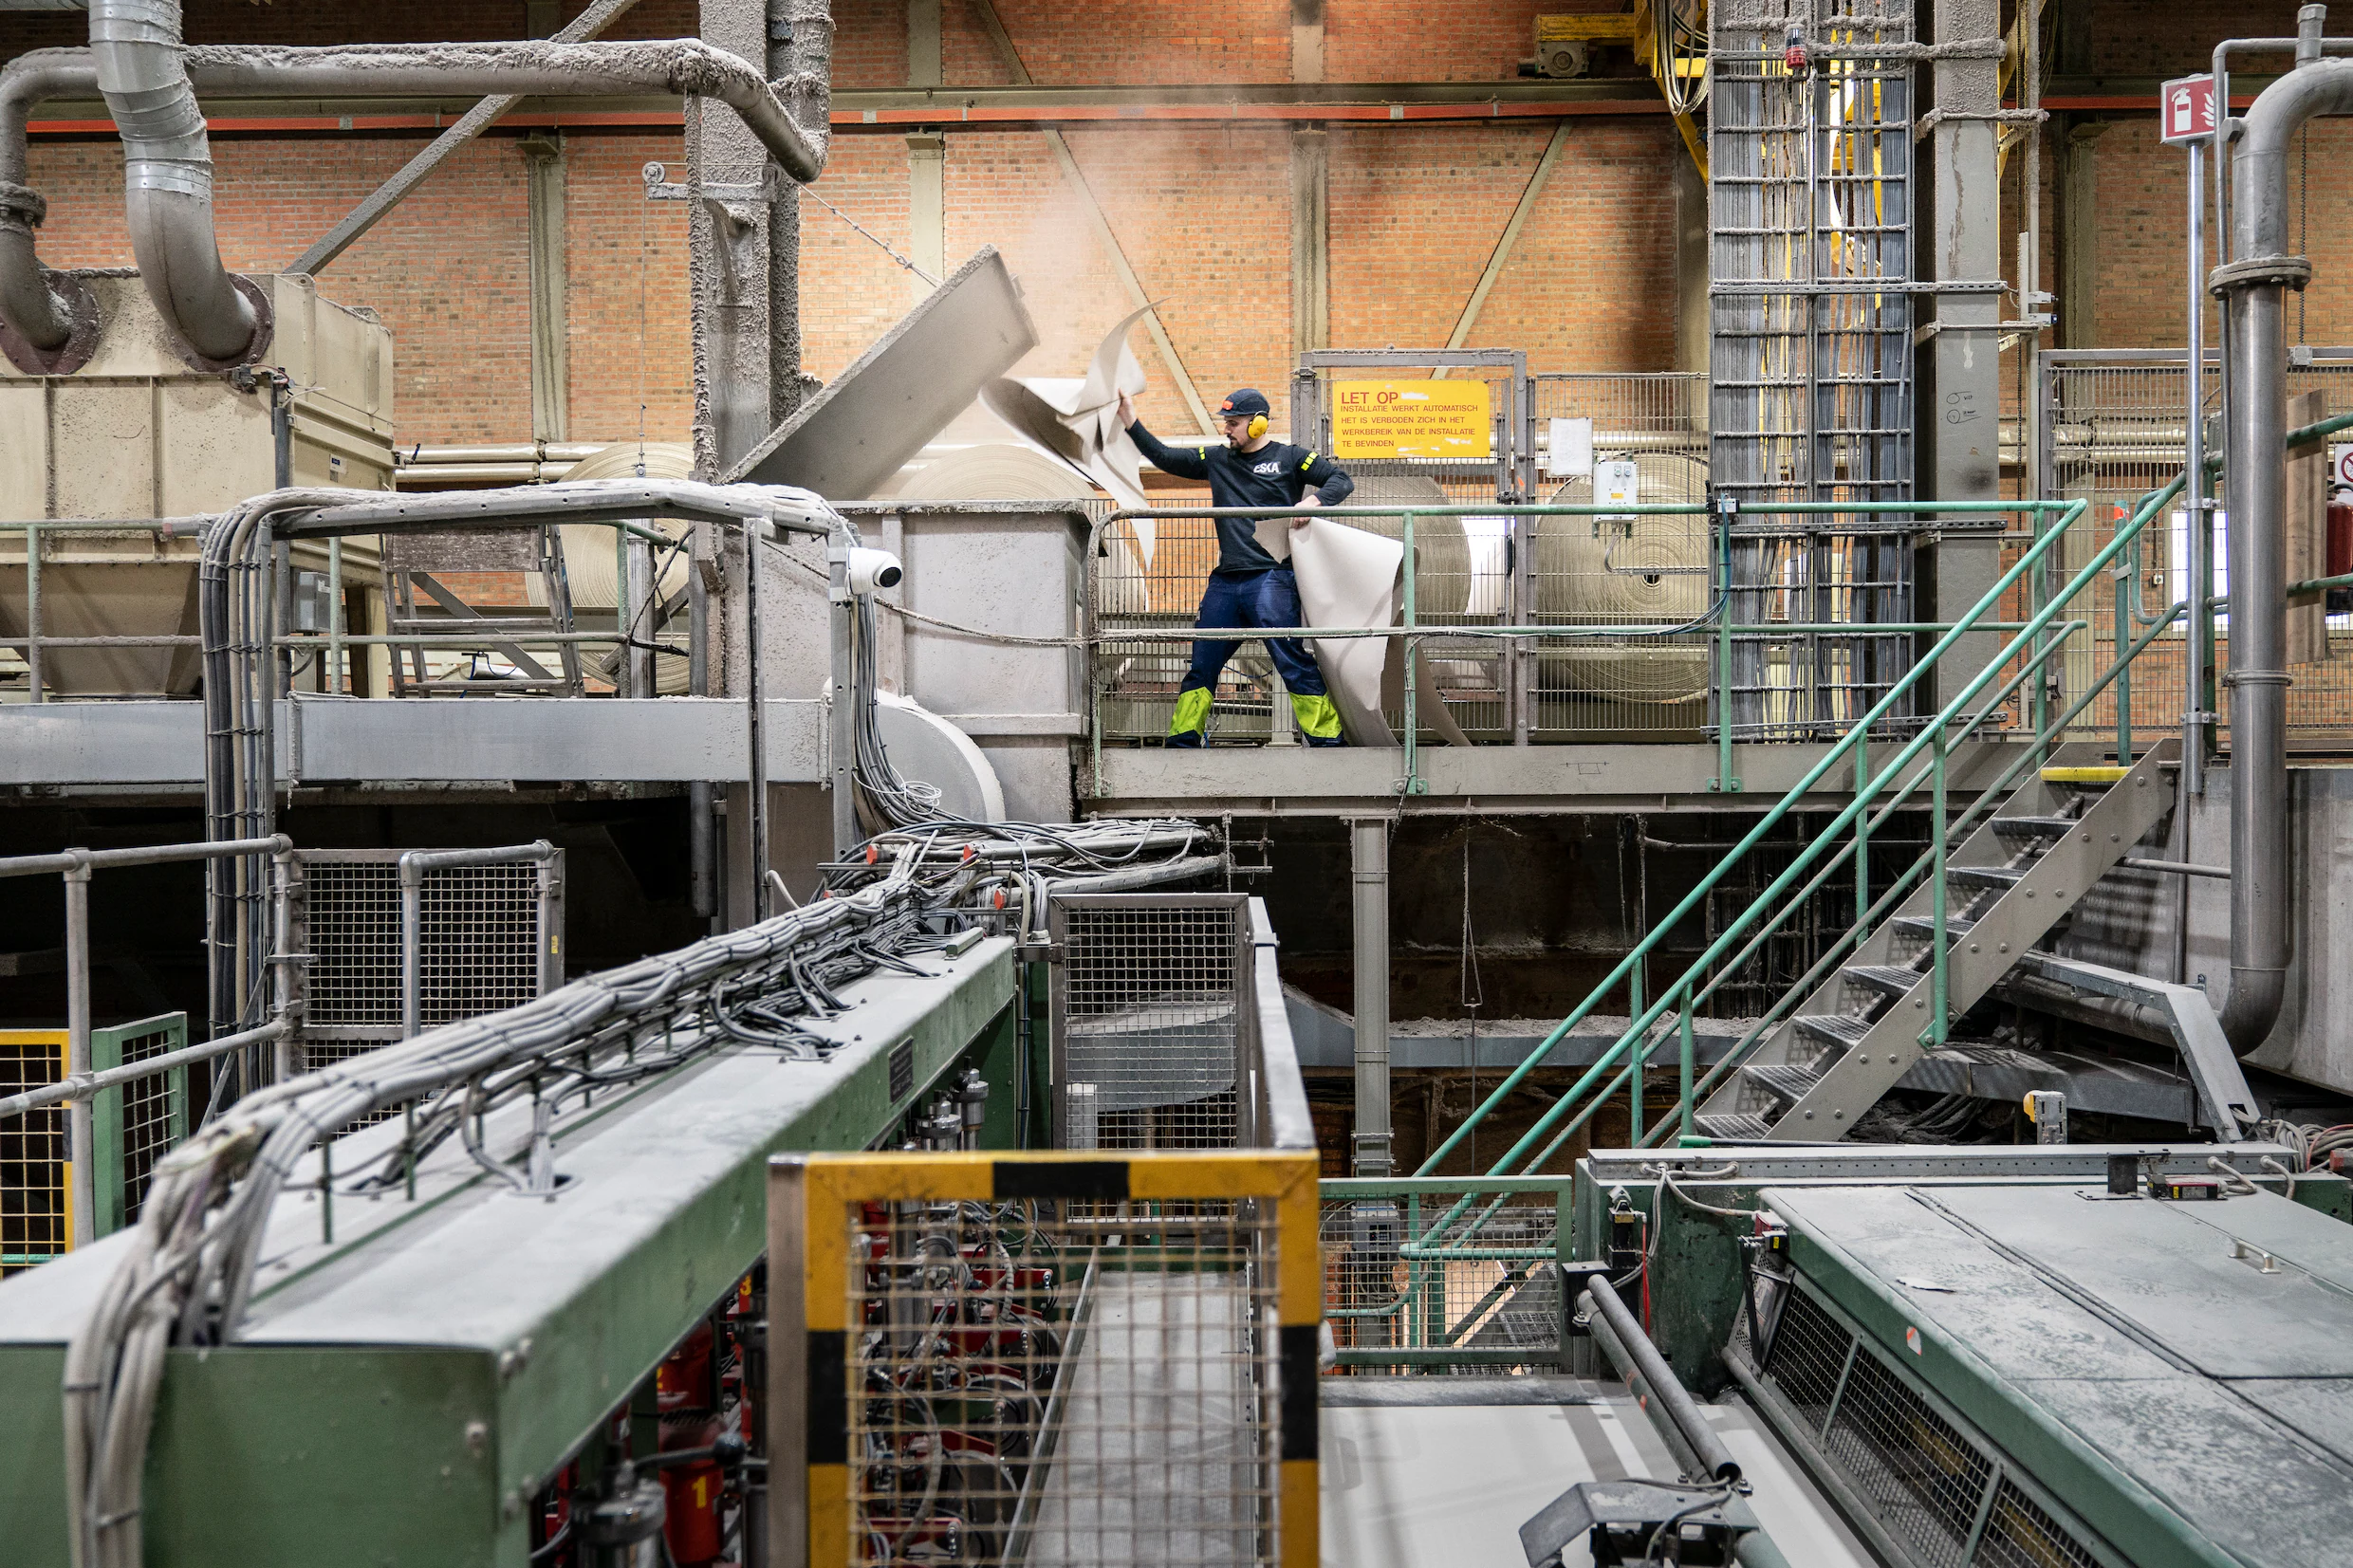
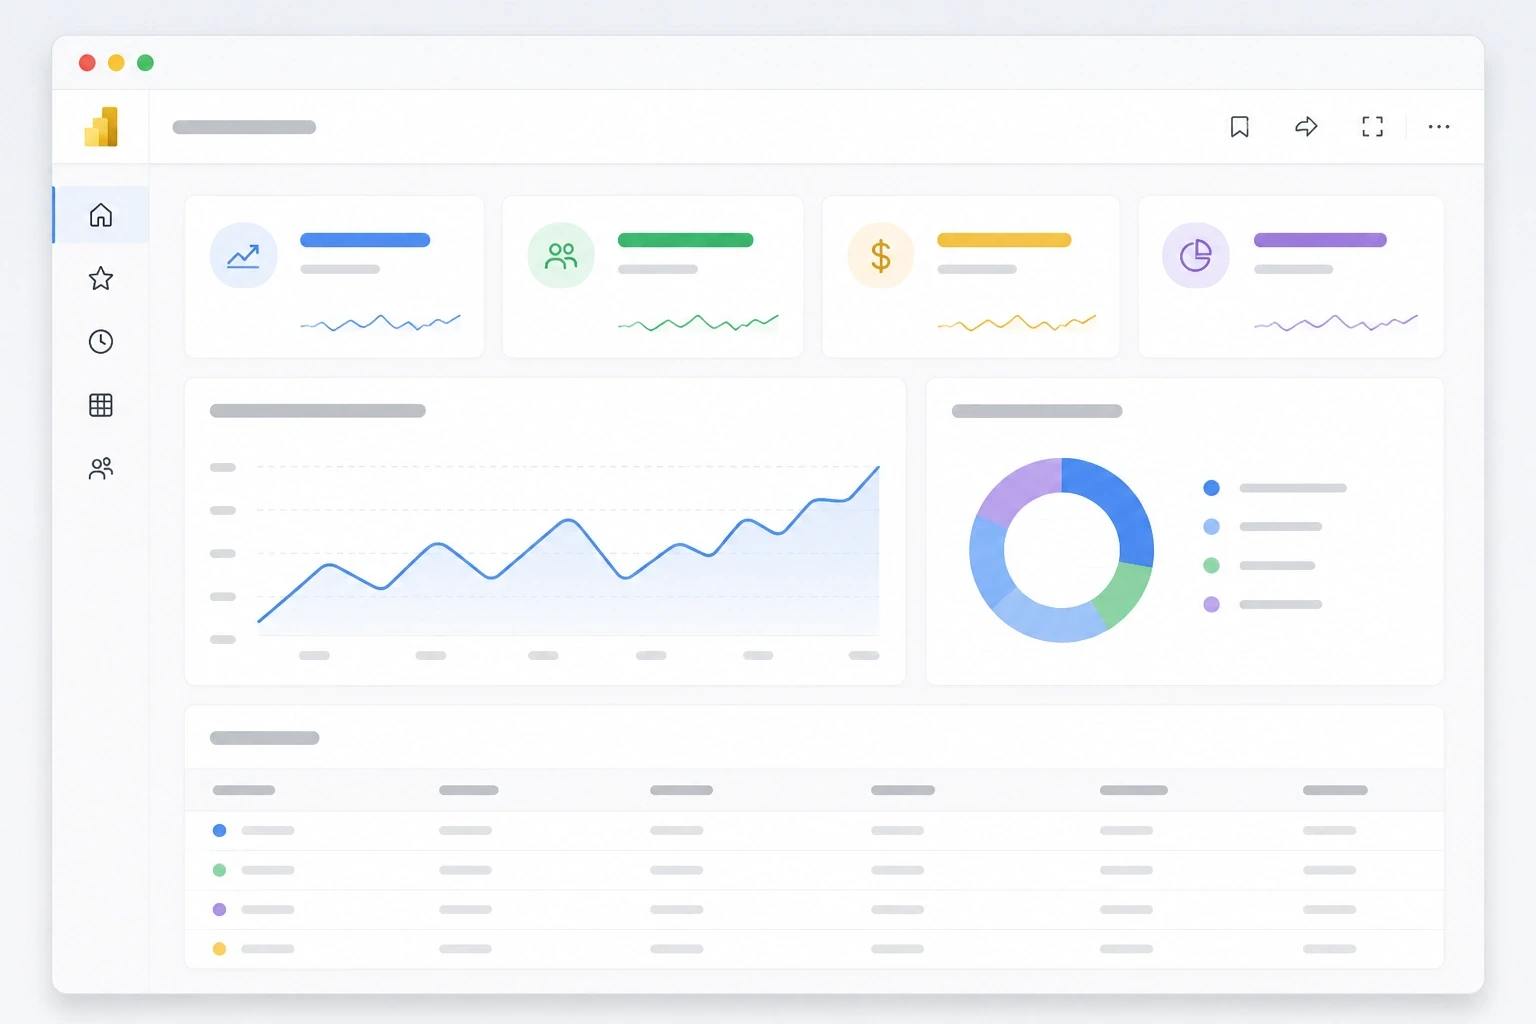
At ESKA, market leader in solid and graphic board, we modernized the BI landscape from a legacy environment to Power BI. We built new dashboards for finance, production, and operations, and reconciled the differences between two inventory systems to achieve a 100% match.
The result: reliable inventory reports and a single source of truth for financial, operational, and production data.
At De Vries Trappen, we replaced manual Excel processes regarding turnover information with a Power BI environment, linked to Exact Online.
The result: 90% time savings on gathering turnover information and 2 FTE savings on administrative work.
solutions
Solutions for manufacturing companies.
Our method.
This approach is no coincidence. It stems from years of experience working on projects at a wide range of organizations. We know where processes get stuck and have designed every step so that you see quick results without unnecessary detours. This is how we handle your time and ours efficiently, and you deliver a dashboard that you can build on from day one.

What does a Power BI dashboard cost for a manufacturing company?
That depends on the number of data sources, the quality of your data, and the number of KPIs you want to track. A dashboard based on a single source is faster and cheaper than a project where production, inventory, and financial data must first be linked. We therefore like to start small, with the question that delivers the most value right now, and build further from there.